
試験TDA-C01-JPN トピック2 問題81 スレッド
Tableau TDA-C01-JPNのリアル試験問題集
問題 #: 81
トピック #: 2
問題 #: 81
トピック #: 2
sales、City、および Region という名前のフィールドを含むデータベースがあります。
さまざまな都市での販売数を示す次のグラフがあります。
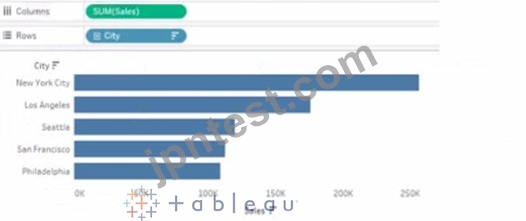
ユーザーがいずれかの棒の上にマウスを置いたときに、対応する領域を動的に表示したいとします。
あなたは何をするべきか?
さまざまな都市での販売数を示す次のグラフがあります。
ユーザーがいずれかの棒の上にマウスを置いたときに、対応する領域を動的に表示したいとします。
あなたは何をするべきか?
おすすめの解答:D 解答を投票する
To show the corresponding region when users hover their mouse over any of the bars, you need to drag Region to Tooltip on the Marks card. This will add Region as a field in the tooltip text that appears when users hover over a mark. You can also customize the tooltip text by editing it in the Tooltip dialog box. Reference: https://help.tableau.com/current/pro/desktop/en-us/buildmanual_shelves.htm https://help.tableau.com/current/pro/desktop/en-us/formatting_tooltips.htm
田中** 2025-06-06 09:10:01
コメント
他人の解答コメントを賛成するのも、その解答に一票を入れることになります。したがって、すでに同じ意見の投票コメントが存在する場合、新規コメントをする代わりに賛成することもできます。
コメントを通報する
コメント中
今すぐ 新規登録 / ログイン (無料です)。