
試験Desktop-Specialist-JPN トピック4 問題11 スレッド
Tableau Desktop-Specialist-JPNのリアル試験問題集
問題 #: 11
トピック #: 4
問題 #: 11
トピック #: 4
はいまたはいいえ:ビューの寸法の数を増やすと、マークの数が増えます
おすすめの解答:B 解答を投票する
Explanation
Of course! As an example, see below:
1) Using the Sample Superstore data, let's plot a bar chart showing the Sales for each Category:
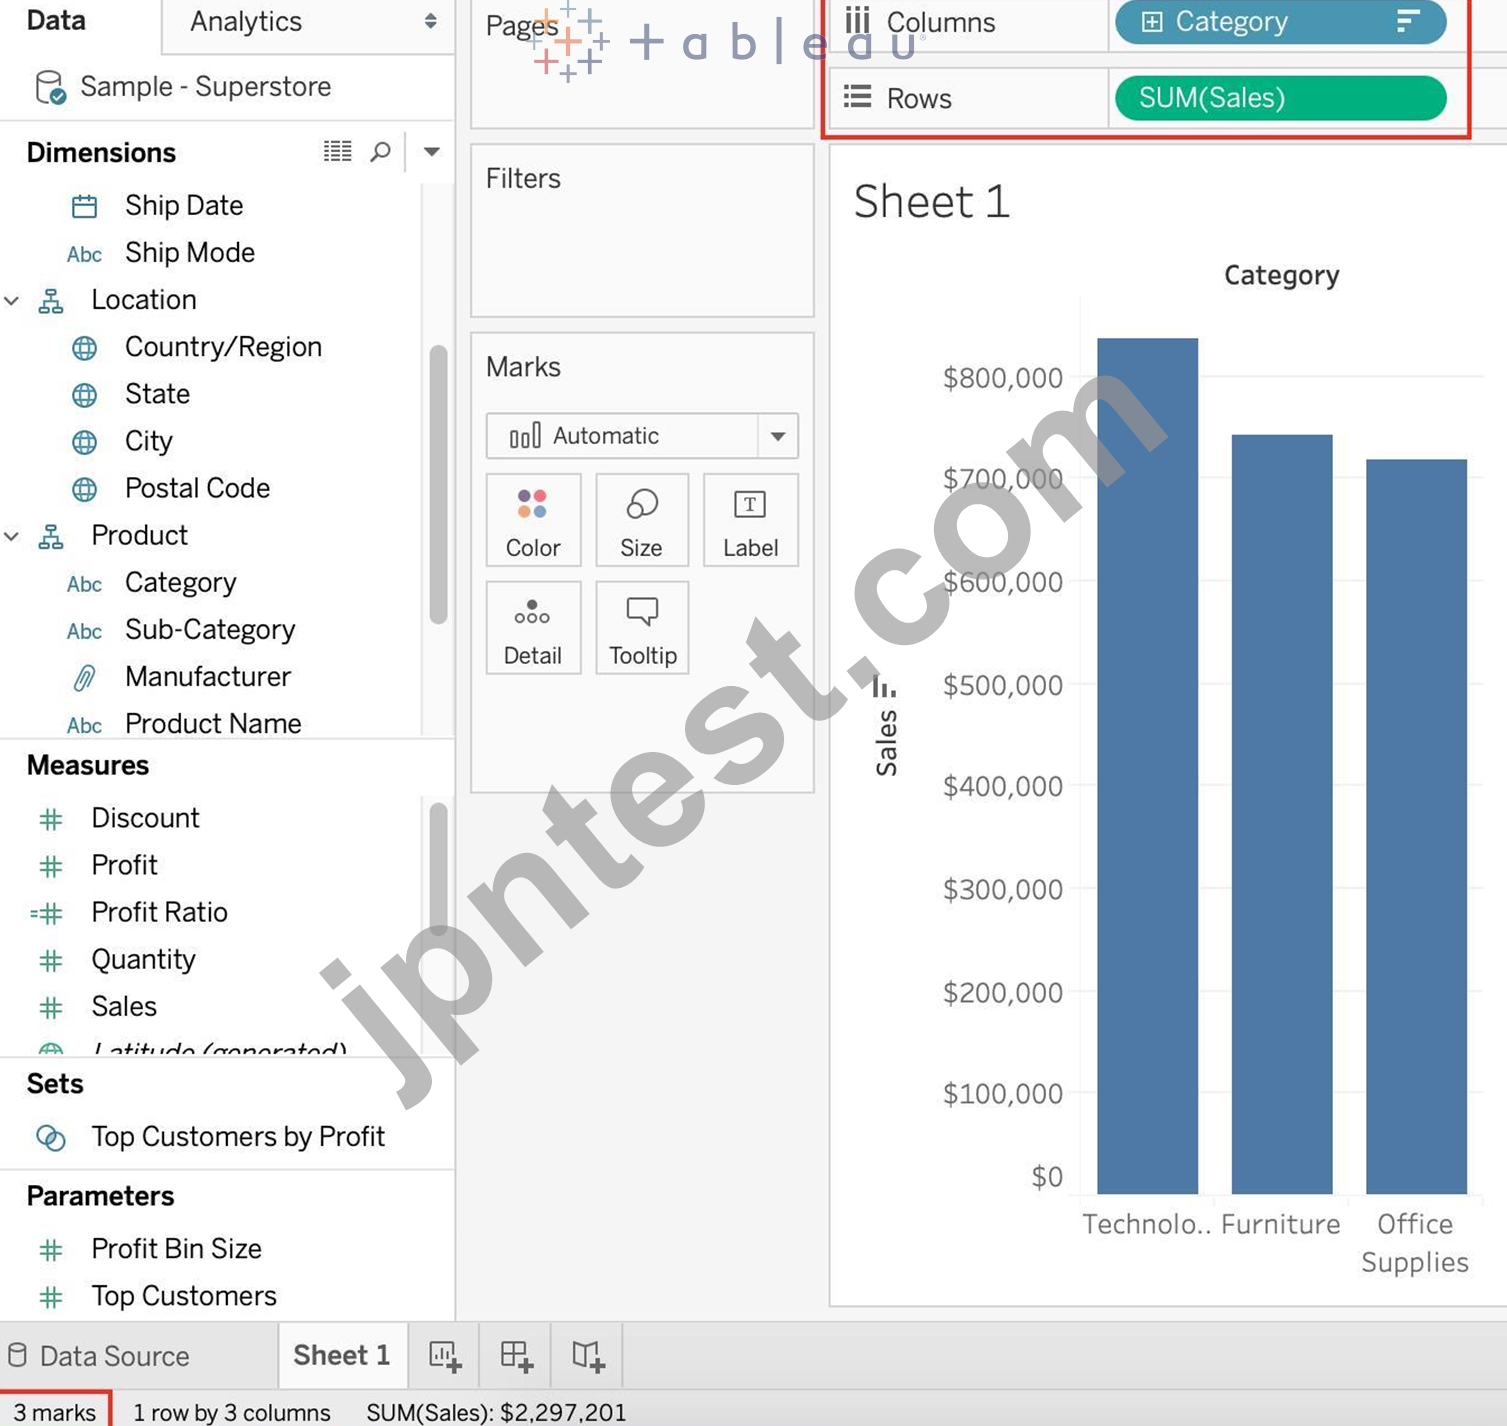
Observe that we have 3 marks - Each bar in a bar chart is called a mark. Similarly, each point in a scatter plot is also a mark , and so on for all charts.
1 row by 3 columns means that clearly on the y-axis (Sales), we have only a single mark - a single continous axis, but 3 different marks (Technology, Furniture and Office supplies ) on the x-axis.
2) Now let's add subcategory to the view as well (another dimension):
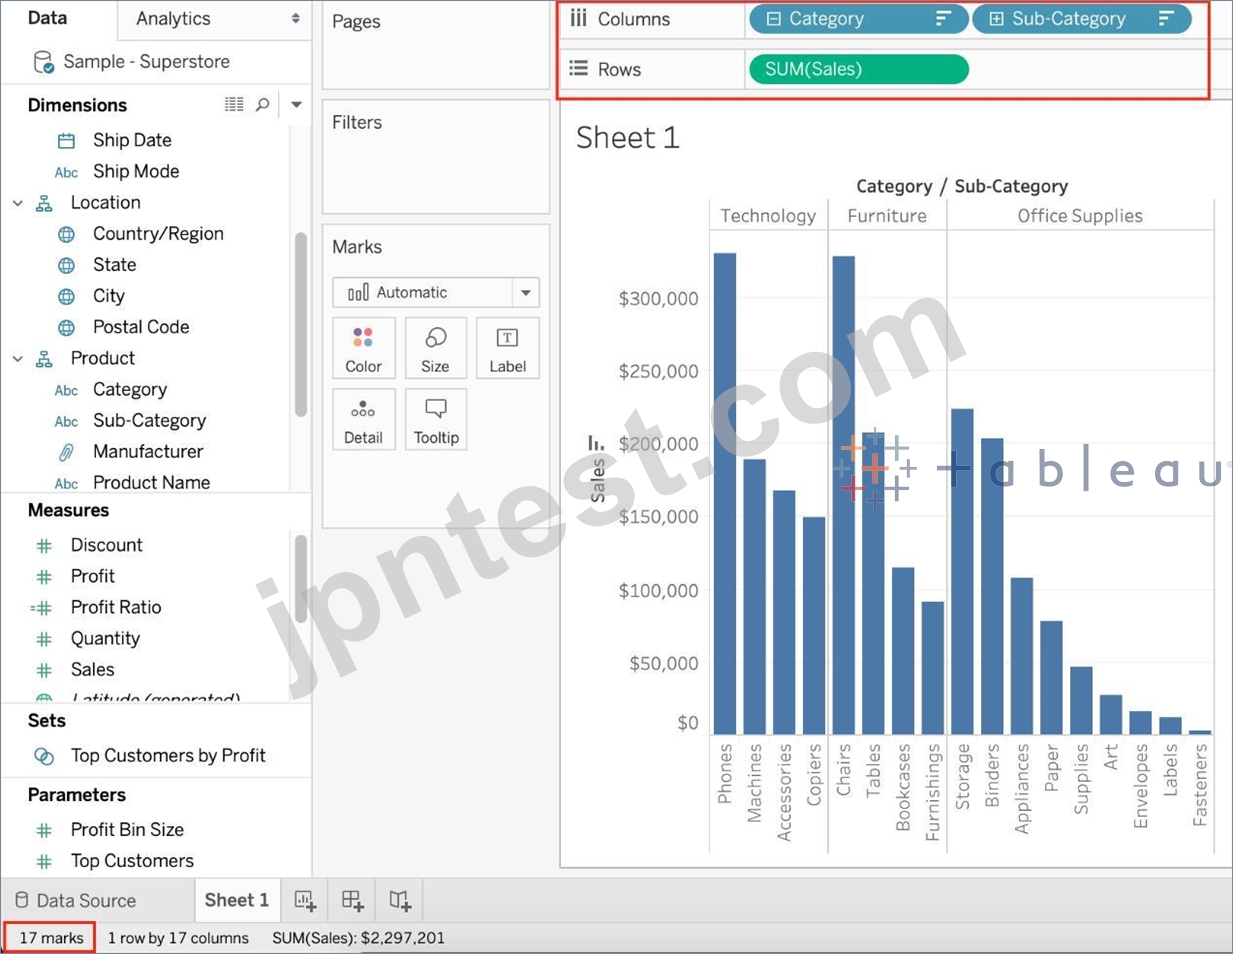
Observe that the number of marks has increased - i.e the number of Bars.
Also, notice we now have 1 row and 17 columns. Simply because 1 row = Sales (on the y-axis), and on the x-axis, we have 17 different columns (i.e product sub categories!!)
Of course! As an example, see below:
1) Using the Sample Superstore data, let's plot a bar chart showing the Sales for each Category:
Observe that we have 3 marks - Each bar in a bar chart is called a mark. Similarly, each point in a scatter plot is also a mark , and so on for all charts.
1 row by 3 columns means that clearly on the y-axis (Sales), we have only a single mark - a single continous axis, but 3 different marks (Technology, Furniture and Office supplies ) on the x-axis.
2) Now let's add subcategory to the view as well (another dimension):
Observe that the number of marks has increased - i.e the number of Bars.
Also, notice we now have 1 row and 17 columns. Simply because 1 row = Sales (on the y-axis), and on the x-axis, we have 17 different columns (i.e product sub categories!!)
浅*夏 2025-06-10 11:21:01
コメント
他人の解答コメントを賛成するのも、その解答に一票を入れることになります。したがって、すでに同じ意見の投票コメントが存在する場合、新規コメントをする代わりに賛成することもできます。
コメントを通報する
コメント中
今すぐ 新規登録 / ログイン (無料です)。