
試験TDA-C01-JPN トピック4 問題90 スレッド
Tableau TDA-C01-JPNのリアル試験問題集
問題 #: 90
トピック #: 4
問題 #: 90
トピック #: 4
デスクトップにある Book1 へのリンクを開きます。「CategoryPercentage」ワークシートを開きます。
すべてのカテゴリ内の各サブカテゴリの売上の割合を示す棒グラフを変更します。各カテゴリの合計パーセンテージは 100% である必要があります。
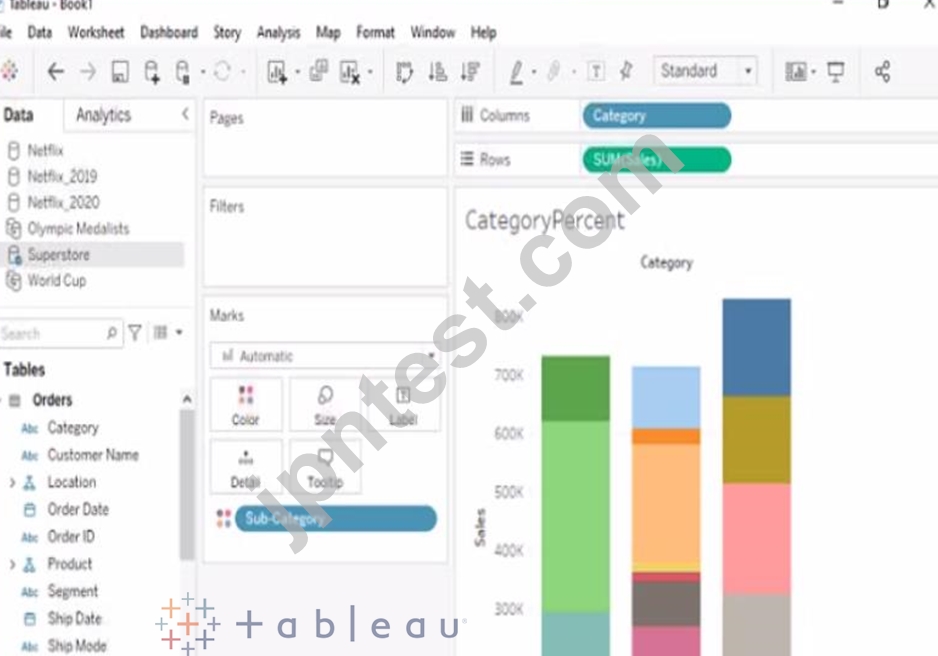
すべてのカテゴリ内の各サブカテゴリの売上の割合を示す棒グラフを変更します。各カテゴリの合計パーセンテージは 100% である必要があります。
おすすめの解答:
check the steps below in explanation
Explanation:
To modify the bar chart to show the percentage of sales for each Subcategory within every Category, you need to do the following steps:
Open the link to Book1 found on the desktop. This will open the Tableau workbook that contains the CategoryPercentage worksheet.
Click on the CategoryPercentage tab at the bottom of the workbook to open the worksheet. You will see a bar chart that shows the total sales for each Subcategory across all Categories.
Right-click on Sales on the Columns shelf and select Add Table Calculation from the menu. This will open a dialog box that allows you to apply a calculation to your measure.
Select Percent of Total from the Calculation Type drop-down list. This will calculate the percentage of sales for each Subcategory out of the total sales for all Subcategories.
Select Category from the Compute Using drop-down list. This will calculate the percentage of sales for each Subcategory within every Category, instead of across all Categories. The total percentage for every Category will be 100%.
Click OK to apply the table calculation. You will see that the bar chart now shows the percentage of sales for each Subcategory within every Category.
Explanation:
To modify the bar chart to show the percentage of sales for each Subcategory within every Category, you need to do the following steps:
Open the link to Book1 found on the desktop. This will open the Tableau workbook that contains the CategoryPercentage worksheet.
Click on the CategoryPercentage tab at the bottom of the workbook to open the worksheet. You will see a bar chart that shows the total sales for each Subcategory across all Categories.
Right-click on Sales on the Columns shelf and select Add Table Calculation from the menu. This will open a dialog box that allows you to apply a calculation to your measure.
Select Percent of Total from the Calculation Type drop-down list. This will calculate the percentage of sales for each Subcategory out of the total sales for all Subcategories.
Select Category from the Compute Using drop-down list. This will calculate the percentage of sales for each Subcategory within every Category, instead of across all Categories. The total percentage for every Category will be 100%.
Click OK to apply the table calculation. You will see that the bar chart now shows the percentage of sales for each Subcategory within every Category.
Adachi 2025-06-11 05:18:48
コメント
他人の解答コメントを賛成するのも、その解答に一票を入れることになります。したがって、すでに同じ意見の投票コメントが存在する場合、新規コメントをする代わりに賛成することもできます。
コメントを通報する
コメント中
今すぐ 新規登録 / ログイン (無料です)。