
試験TDA-C01-JPN トピック4 問題60 スレッド
Tableau TDA-C01-JPNのリアル試験問題集
問題 #: 60
トピック #: 4
問題 #: 60
トピック #: 4
ワークシートに折れ線グラフがあります。
次の視覚化に示すように、2020 年 3 月にコメントを追加します。
あなたは何をするべきか?
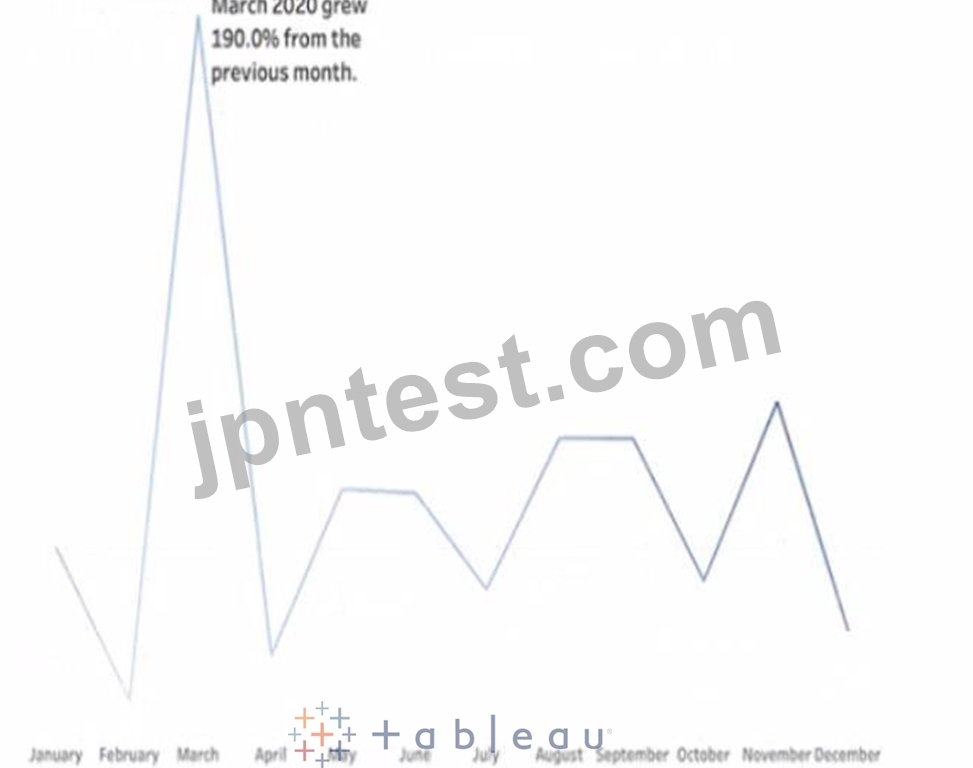
次の視覚化に示すように、2020 年 3 月にコメントを追加します。
あなたは何をするべきか?
おすすめの解答:C 解答を投票する
To add a comment to March 2020 on a line chart, you need to annotate that mark. You can right-click on the mark and select Annotate > Mark from the menu. This will open a dialog box where you can type your comment and format it as you like. You can also drag and drop the annotation to position it on the worksheet.
Dragging the growth rate to Text on the Marks card will add a label to every mark on the line chart, enabling captions will show a description of the worksheet at the bottom, and adding a tooltip will show a text box when users hover over a mark. References:
https://help.tableau.com/current/pro/desktop/en-us/formatting_annotations.htm
https://help.tableau.com/current/pro/desktop/en-us/formatting_annotations_create.htm To add a comment to a specific point on a line chart, such as March 2020 in the provided visualization, you would use the 'Annotate' feature. Right-clicking on the data point for March 2020 and selecting 'Annotate' allows you to add a text annotation directly to the chart, which can be used to highlight and comment on that particular data point.
Dragging the growth rate to Text on the Marks card will add a label to every mark on the line chart, enabling captions will show a description of the worksheet at the bottom, and adding a tooltip will show a text box when users hover over a mark. References:
https://help.tableau.com/current/pro/desktop/en-us/formatting_annotations.htm
https://help.tableau.com/current/pro/desktop/en-us/formatting_annotations_create.htm To add a comment to a specific point on a line chart, such as March 2020 in the provided visualization, you would use the 'Annotate' feature. Right-clicking on the data point for March 2020 and selecting 'Annotate' allows you to add a text annotation directly to the chart, which can be used to highlight and comment on that particular data point.
堤あ** 2025-06-14 06:30:02
コメント
他人の解答コメントを賛成するのも、その解答に一票を入れることになります。したがって、すでに同じ意見の投票コメントが存在する場合、新規コメントをする代わりに賛成することもできます。
コメントを通報する
コメント中
今すぐ 新規登録 / ログイン (無料です)。