

更新された2025年03月公式問題PL-300認定にはPL-300問題集PDF
2025年最新のに更新された最新PL-300問題集を掴み取れ!
Microsoft PL-300 試験は、複数の選択肢の問題とシナリオから構成されており、候補者は Power BI の知識を実際のシチュエーションに適用する必要があります。この試験は、データ分析と可視化の異なる側面に焦点を当てたいくつかのセクションに分かれています。これらのセクションには、データモデリング、ダッシュボード作成、データの準備、レポート作成が含まれています。候補者は、試験に合格するために、これらのすべての分野での熟練度を示す必要があります。
PL-300試験は、データモデリング、データ可視化、データ分析、データ統合など、Power BIのさまざまな側面に焦点を当てています。この試験では、データモデルの作成と管理、レポート・ダッシュボードの作成、DAXやPower Queryといった高度な分析機能の使用などのスキルを評価します。また、候補者は、Power BIを他のMicrosoft製品やサードパーティ製品に統合する能力もテストされます。
Microsoft PL-300(Microsoft Power BI Data Analyst)認定試験は、Microsoft Power BIプラットフォームの使用に関する専門知識を実証したい個人向けに設計されています。この認定試験では、Power BIソリューションの設計、構築、展開のスキルと知識を測定します。この試験は、ビジネスアナリスト、データアナリスト、およびデータを使用し、Power BIでスキルを向上させたい他の専門家を対象としています。
質問 # 196
You are creating a query to be used as a Country dimension in a star schema.
A snapshot of the source data is shown in the following table.
You need to create the dimension. The dimension must contain a list of unique countries.
Which two actions should you perform? Each correct answer presents part of the solution.
- A. Remove duplicates from the City column.
- B. Delete the City column.
- C. Remove duplicates from the Country column.
- D. |Remove duplicates from the table.
- E. Delete the Country column.
正解:B、C
解説:
Explanation
To create a dimension table for Country from your source data, you need to perform these two actions34:
Delete the City column. You don't need this column for your Country dimension, as it is not a descriptive attribute of Country. You can create another dimension table for City if you want to use it in your analysis.
Remove duplicates from the Country column. You want to have a list of unique countries in your dimension table, so you need to remove any duplicate values from this column.
質問 # 197
You manage a Power BI model has a table named Sales and product.
You need to ensure that a sales team can view only data that has a CountryRegionName value of United States and a ProductCategory value of Clothing.
What should you do from Power BI Desktop?
- A. Add the following filters in Query Editor.CountryRegionName is United StatesProductCategory is Clothing
- B. From Power BI Desktop, create a new role that has the following filters.[CountryRegionName]=
"United States" - C. Add the following filters to a report.CountryRegionName is United SatesProductCategory is Clothing
- D. From Power BI Desktop, create a new role that has the following filter.[countryRegionName]= "United States" && [ProductCategory]= "Clothing"
正解:C
解説:
Explanation
References: https://docs.microsoft.com/en-us/power-bi/power-bi-how-to-report-filter
質問 # 198
You need to calculate the last day of the month in the balance sheet data to ensure that you can relate the balance sheet data to the Date table. Which type of calculation and which formula should you use? To answer, select the appropriate options in the answer are a. NOTE: Each correct selection is worth one point.
正解:
解説:
Reference:
https://docs.microsoft.com/en-us/dax/endofquarter-function-dax
質問 # 199
You are modifying a Power Bi model by using Power Bl Desktop.
You have a table named Sales that contains the following fields.
You have a table named Transaction Size that contains the following data.
You need to create a calculated column to classify each transaction as small, medium, or large based on the value in Sales Amount.
How should you complete the code? To answer, drag the appropriate values to the correct targets. Each value may be used once, more than once, or not at all.
You may need to drag the split bar between panes or scroll to view content.
NOTE: Each correct selection is worth one point.
正解:
解説:
Explanation
FILTER | AND | CALCULATE
質問 # 200
You have a Power Bl table named Customer that contains a field named Email Address.
You discover that multiple records contain the same email address.
You need to create a calculated column to identify which records have duplicate email addresses.
How should you complete the OAX expression for the calculated column? To answer, drag the appropriate values to the correct targets. Each value may be used once, more than once, or not at all. You may need to drag the split bar between panes or scroll to view content NOTE: Each correct selection is worth one point.
正解:
解説:
Explanation
You are to count the number of rows having same email address.
1. Declare a variable and call it any name you prefer
2. Calculate the row count on the table
3. Apply filter to ALL of the values in the table under the column name email address and equate it to the variable.
You may need to read up filter functions for a proper understanding of how it works.
質問 # 201
You need to create a Power Bl report. The first page or the report must contain the following two views:
* Sales By Postal Code
* Sales by Month
Both views must display a slicer to select a value for a field named Chain.
The Sales By Postal Code view must display a map visual as shown in the following exhibit.
正解:
解説:
Explanation:
質問 # 202
You have a Power BI imported dataset that contains the data model shown in the following exhibit.
Use the drop-down menus to select the answer choice that completes each statement based on the information presented in the graphic.
NOTE: Each correct selection is worth one point.
正解:
解説:
Explanation
- cross filter direction
- star schema
質問 # 203
You need to design the data model and the relationships for the Customer Details worksheet and the Orders table by using Power BI. The solution must meet the report requirements.
For each of the following statement, select Yes if the statement is true, Otherwise, select No.
NOTE: Each correct selection is worth one point.
正解:
解説:
質問 # 204
You have a report page that contains the visuals shown in the following exhibit.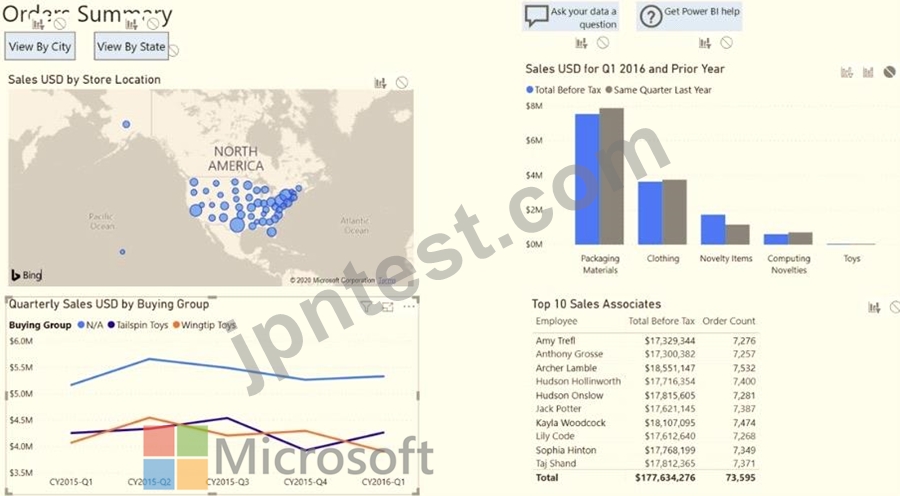
Use the drop-down menus to select the answer choice that completes each statement based on the information presented in the graphic. NOTE: Each correct selection is worth one point.
正解:
解説:
Reference:
https://docs.microsoft.com/en-us/power-bi/consumer/end-user-interactions
質問 # 205
You plan to create a dashboard in the Power BI service that retrieves data from a Microsoft SQL Server database. The dashboard will be shared between the users in your organization.
You need to ensure that the users will see the current data when they view the dashboard.
How should you configure the connection to the data source?
- A. Deploy an on-premises data gateway. Import the data by using the DirectQuery Data Connectivity mode.
- B. Deploy an on-premises data gateway. Import the data by using the Import Data Connectivity mode.
- C. Deploy an on-premises data gateway (personal mode). Import the data by using the DirectQuery Data Connectivity mode.
- D. Deploy an on-premises data gateway (personal mode). Import the data by using the Import Data Connectivity mode.
正解:C
解説:
References:
https://docs.microsoft.com/en-us/power-bi/desktop-directquery-about#power-bi-connectivity-modes
質問 # 206
You embed a Power BI report in a Microsoft SharePoint Online page.
A user name User1 can access the SharePoint Online page, but the Power BI web part displays the following error message: "This content isn't available".
User1 is unable to view the report.
You verify that you can access the SharePoint Online page and that the Power BI report displays as expected.
You need to ensure that User1 can view the report form SharePoint Online.
What should you do?
- A. Share the dashboards in the app workspace.
- B. Publish the app workspace.
- C. Modify the members of the app workplace.
- D. Edit the settings of the Power BI web part.
正解:C
解説:
References: https://docs.microsoft.com/en-us/power-bi/service-embed-report-spo
質問 # 207
You have a collection of reports for the HR department of your company.
You need to create a visualization for the HR department that shows a historic employee counts and predicts trends during the next six months.
Which type of visualization should you use?
- A. ribbon chart
- B. scatter chart
- C. key influences
- D. line chart
正解:D
解説:
Explanation
The best data for forecasting is time series data or uniformly increasing whole numbers. The line chart has to have only one line.
Try forecasting: Try the new forecasting capabilities of Power View today on your own data or with the sample report available as part of the Power BI report samples. To view your own data, upload a workbook with a Power View time series line chart to Power BI for Office 365.
Reference:
https://powerbi.microsoft.com/en-us/blog/introducing-new-forecasting-capabilities-in-power-view-for-office-365
質問 # 208
You are creating reports in Power BI Desktop. The model has the following tables.
There is a relationship between the tables.
You plan to publish a report to the Power BI service that displays Order_amount by Order_date by Full_name.
You need to ensure that only the columns required for the report appear in Report View. The solution must minimize the size of the dataset that is published.
How should you configure the columns in Power BI Desktop? To answer, select the appropriate options in the answer area.
NOTE: Each correct selection is worth one point.
正解:
解説:
Explanation:
Table Description automatically generated
質問 # 209
You are profiling data by using Power Query Editor.
You have a table that contains a column named column1. Column statistics and Value distribution for column1 are shown in the following exhibit.

正解:
解説:
Explanation:
質問 # 210
You need to create a visualization to meet the reporting requirements of the sales managers.
How should you create the visualization? To answer, select the appropriate options in the answer area.
NOTE: Each correct selection is worth one point.
正解:
解説:
Explanation:
Scenario: The sales managers require a visual to analyze sales performance versus sales targets.
Box 1: KPI
A Key Performance Indicator (KPI) is a visual cue that communicates the amount of progress made toward a measurable goal.
Box 2: Sales[sales_amount]
Box 3: Date[month]
Time > FiscalMonth. This value will represent the trend.
Box 4: Targets[sales_target]
Reference:
https://docs.microsoft.com/en-us/power-bi/visuals/power-bi-visualization-kpi
質問 # 211
You have a Power BI data model that analyzes product sales ever time. The data model contains the following tables.
A one-to-many relationship exists between the tables.
The auto date/time option for the data model enabled.
You need to reduce the size of the data model while maintaining the ability to analyze product sales by month and quarter.
Which two actions should you perform?
- A. Option C
- B. Option B
- C. Option A
- D. Option D
正解:C、D
質問 # 212
You are profiling data by using Power Query Editor.
You have a table named Reports that contains a column named State. The distribution and quality data metrics for the data m State is shown in the following exhibit.
Use the drop-down menus to select the answer choice that completes each statement based on the information presented in the graphic.
NOTE: Each correct selection is worth one point.
正解:
解説:
質問 # 213
......
最新のPL-300試験問題集でMicrosoft試験にはトレーニング:https://www.jpntest.com/shiken/PL-300-mondaishu
最新を提供していますPL-300問題集でMicrosoft Certified: Power BI Data Analyst Associate認定:https://drive.google.com/open?id=1T5uN5CKR42tSQm9Zo-0VbgpbdBWVcbzm