

 359 お客様のコメント
 クリック」

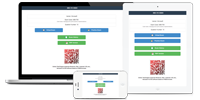
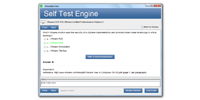

便利なPDFダウンロードモード
ユーザーのオフラインでの読解を容易にするために、PL-300学習問題集は、特にユーザー向けのPDFモードを開発するために、破片の時間を学習に使用することができます。 このモードでは、ユーザーはダウンロードして印刷すること、紙にメモを取ることが簡単であること、および自分の記憶の弱いリンクを学ぶために、教材内のPL-300準備ガイドを知ることができます。 我々のPL-300試験問題とユーザの効率を非常に改善します。 あるいは、いわゆる「いい」を忘れてしまうかもしれませんが、今ではオンラインで読むのに便利なあらゆる種類のデジタル機器ですが、私たちの多くは、彼らの記憶パターンを深めるために書面で使われています。 私たちのPL-300準備ガイドは、この点でユーザーの需要を満たすのに非常に良いものです。ユーザーが良い環境で読み書きできるようにすることで、学んだことを継続的に統合することができます。
私たちのPL-300研究の問題集は、この点でユーザの要求を満たすのに非常に役立ちます。PL-300準備ガイドは高品質です。 それでテストの準備をするためのすべての効果的な中心的な習慣があります。 私たちの職業的能力により、PL-300試験問題を編集するのに必要なテストポイントに同意することができます。 それはあなたの難しさを解決するための試験の中心を指しています。 だから高品質の材料はあなたが効果的にあなたの試験に合格し、目標を達成するために簡単に感じるようにすることができます。
Microsoft PL-300 認定試験の出題範囲:
| トピック | 出題範囲 |
|---|---|
| トピック 1 |
|
| トピック 2 |
|
| トピック 3 |
|
| トピック 4 |
|
参照:https://docs.microsoft.com/en-us/learn/certifications/exams/pl-300
さまざまな記憶方法
毎日新しい知識を学んでいるだけでなく、常に忘れられていた知識も私たちは記憶と鍛造の過程にあったと言うことができます。 これには優れたメモリアプローチが必要です、そしてPL-300研究の脳ダンプはそれを上手く行います。PL-300準備ガイドは、テキスト、画像、グラフィックメモリ方式などの多様化を採用し、情報を学ぶためにマークアップを区別する必要があります。 全体的なレイアウト、目標とされた長期記憶の形成へのより良い手がかり、そして実践のサイクルを通して、知識をより深く私の頭の中に印刷させてください。PL-300試験問題は非常に科学的かつ妥当であり、あなたは簡単にすべてを覚えることができます。
強力なユーザー共有プラットフォーム
もちろん、個人的な学習効果は特に目立ちません。なぜなら、この問題を解決するために、テストの難点、良いアップデートを同時に得られないという最新の試験の傾向を掴むのは難しいからです。 圧倒的多数のユーザーのためのPL-300研究問題集は、ユーザーが共有するための強力なプラットフォームを提供します。 ここでは、PL-300試験問題のすべてのユーザが自分のID番号を通してプラットフォームと他のユーザにログオンして共有し交換することができ、プラットフォーム上でさらに仲良くなるために多くの人々と努力することができます。 他の、学習や生活の中で彼らの困難を解決するためにお互い。PL-300準備ガイドは、学習環境だけでなく、家庭のような学習環境を作成することもできます。
Microsoft Power BI Data Analyst 認定 PL-300 試験問題:
You have a Power BI semantic model that contains quarterly sales performance data.
You need to enable managers to review the data in a format that meets the following requirements:
; Is optimized for printing.
; Renders data in Microsoft Excel, Word, PowerPoint, and PDF formats.
What should you create?
- A. a template app
- B. a dashboard
- C. an interactive report
- D. a paginated report
正解:D 🗳️
解説: (JPNTest メンバーにのみ表示されます)
You have the CSV file shown in the following table.
You use Power Query Editor to preview the data in the file.
You need to transform the data to meet the following requirements:
; The first column must contain the month.
; The second column must contain the year.
; The third column must contain the order amount for the month and year.
Which transformation should you use first?
- A. pivot
- B. unpivot
- C. remove
- D. transpose
正解:B 🗳️
解説: (JPNTest メンバーにのみ表示されます)
You are building a Power BI report to analyze customer segments.
You need to identify customer segments dynamically based on the Bounce Rate across dimensions such as source, geography, and demographics. The solution must minimize analysis effort.
Which type of visualization should you use?
- A. funnel chart
- B. Q & A
- C. key influencers
- D. decomposition tree
正解:D 🗳️
解説: (JPNTest メンバーにのみ表示されます)
Once the profit and loss semantic model is created, which four actions should you perform in sequence to ensure that the business unit analysts see the appropriate profit and loss data? To answer, move the appropriate actions from the list of actions to the answer area and arrange them in the correct order.
正解:

Explanation:
The completed mapping shown in the answer area is correct. The scenario is asking for a way to Once the profit and loss semantic model is created, which four actions should you perform in sequence to ensure that the business unit analysts see the appropriate profit and loss data. The required service action depends on whether the person must consume, build, publish, or administer content. Selecting the narrowest workspace role prevents an unrelated permission from being granted implicitly. This directly matches the current study- guide objective " Assign workspace roles " . A broader role would grant unnecessary authoring or administration, while Viewer cannot create or publish workspace content.
Microsoft Learn reference: https://learn.microsoft.com/en-us/power-bi/collaborate-share/service-roles-new- workspaces | PL-300 objective: " Assign workspace roles " | Study guide: https://learn.microsoft.com/en-us
/credentials/certifications/resources/study-guides/pl-300
You have a Microsoft Excel workbook that contains two tables.
From Power BI, you create a dashboard that displays data from the tables.
You update the tables each day.
You need to ensure that the visualizations in the dashboard are updated daily.
Which three actions should you perform in sequence? To answer, move the appropriate actions from the list of actions to answer area and arrange them in the correct order.
正解:

Explanation:
The retained answer-area mapping contains the correct selections. The scenario is asking for a way to ensure that the visualizations in the dashboard are updated daily. Editing only the source report does not necessarily update an existing dashboard tile ' s type, placement, theme, or phone layout. A dashboard is a Power BI service canvas made from pinned tiles. Tile behavior, themes, mobile layout, and pinning are managed separately from the report page that supplied a visual. In Microsoft ' s current exam outline, the corresponding objective is " Create dashboards " . This keeps service access and operational behavior within the scope requested instead of granting or changing unrelated capabilities.
Microsoft Learn reference: https://learn.microsoft.com/en-us/power-bi/create-reports/service-dashboard-tiles
| PL-300 objective: " Create dashboards " | Study guide: https://learn.microsoft.com/en-us/credentials
/certifications/resources/study-guides/pl-300
全 95 ページ中 1 ページ目を表示しています。
全 472 問中 1-5 問目を表示しています。


 0
 0
 0
 0
