

[2025年06月06日]DP-100試験問題集を試そう!ベストDP-100試験問題
検証済みのDP-100テスト問題集で正確な510問題と解答
質問 # 229
You are creating data wrangling and model training solutions in an Azure Machine Learning workspace.
You must use the same Python notebook to perform both data wrangling and model training.
You need to use the Azure Machine Learning Python SDK v2 to define and configure the Synapse Spark pool asynchronously in the workspace as dedicated compute How should you complete the rode segment? To answer, select the appropriate options in the answer area.
NOTE: Lach correct selection is worth one point.
正解:
解説:
Explanation:
質問 # 230
You create an Azure Machine Learning workspace.
You must create a custom role named that meets the following requirements:
Role members must not be able to delete the workspace.
Role members must not be able to create, update, or delete compute resource in the workspace.
Role members must not be able to add new users to the workspace.
You need to create a JSON file for the DataScientist role in the Azure Machine Learning workspace.
The custom role must enforce the restrictions specified by the IT Operations team.
Which JSON code segment should you use?
- A.

- B.

- C.

- D.

正解:A
解説:
Explanation
The following custom role can do everything in the workspace except for the following actions:
It can't create or update a compute resource.
It can't delete a compute resource.
It can't add, delete, or alter role assignments.
It can't delete the workspace.
To create a custom role, first construct a role definition JSON file that specifies the permission and scope for the role. The following example defines a custom role named "Data Scientist Custom" scoped at a specific workspace level:
data_scientist_custom_role.json :
{
"Name": "Data Scientist Custom",
"IsCustom": true,
"Description": "Can run experiment but can't create or delete compute.",
"Actions": ["*"],
"NotActions": [
"Microsoft.MachineLearningServices/workspaces/*/delete",
"Microsoft.MachineLearningServices/workspaces/write",
"Microsoft.MachineLearningServices/workspaces/computes/*/write",
"Microsoft.MachineLearningServices/workspaces/computes/*/delete",
"Microsoft.Authorization/*/write"
],
"AssignableScopes": [
"/subscriptions/<subscription_id>/resourceGroups/<resource_group_name>/providers/Microsoft.MachineLearni
]
}
Reference:
https://docs.microsoft.com/en-us/azure/machine-learning/how-to-assign-roles
質問 # 231
You need to configure the Feature Based Feature Selection module based on the experiment requirements and datasets.
How should you configure the module properties? To answer, select the appropriate options in the dialog box in the answer area.
NOTE: Each correct selection is worth one point.
正解:
解説:
Explanation:
Box 1: Mutual Information.
The mutual information score is particularly useful in feature selection because it maximizes the mutual information between the joint distribution and target variables in datasets with many dimensions.
Box 2: MedianValue
MedianValue is the feature column, , it is the predictor of the dataset.
Scenario: The MedianValue and AvgRoomsinHouse columns both hold data in numeric format. You need to select a feature selection algorithm to analyze the relationship between the two columns in more detail.
References:
https://docs.microsoft.com/en-us/azure/machine-learning/studio-module-reference/filter-based-feature- selection
質問 # 232
Hotspot Question
You are a lead data scientist for a project that tracks the health and migration of birds. You create a multi- image classification deep learning model that uses a set of labeled bird photos collected by experts. You plan to use the model to develop a cross-platform mobile app that predicts the species of bird captured by app users.
You must test and deploy the trained model as a web service. The deployed model must meet the following requirements:
- An authenticated connection must not be required for testing.
- The deployed model must perform with low latency during inferencing.
- The REST endpoints must be scalable and should have a capacity to
handle large number of requests when multiple end users are using the
mobile application.
You need to verify that the web service returns predictions in the expected JSON format when a valid REST request is submitted.
Which compute resources should you use? To answer, select the appropriate options in the answer area.
NOTE: Each correct selection is worth one point.
正解:
解説:
Explanation:
Box 1: ds-workstation notebook VM
An authenticated connection must not be required for testing. On a Microsoft Azure virtual machine (VM), including a Data Science Virtual Machine (DSVM), you create local user accounts while provisioning the VM. Users then authenticate to the VM by using these credentials.
Box 2: gpu-compute cluster
Image classification is well suited for GPU compute clusters
Reference:
https://docs.microsoft.com/en-us/azure/machine-learning/data-science-virtual-machine/dsvm- common-identity
https://docs.microsoft.com/en-us/azure/architecture/reference-architectures/ai/training-deep- learning
質問 # 233
Hotspot Question
You need to build a feature extraction strategy for the local models.
How should you complete the code segment? To answer, select the appropriate options in the answer area.
NOTE: Each correct selection is worth one point.
正解:
解説:
Case Study
Overview
You are a data scientist for Fabrikam Residences, a company specializing in quality private and commercial property in the United States. Fabrikam Residences is considering expanding into Europe and has asked you to investigate prices for private residences in major European cities.
You use Azure Machine Learning Studio to measure the median value of properties. You produce a regression model to predict property prices by using the Linear Regression and Bayesian Linear Regression modules.
Datasets
There are two datasets in CSV format that contain property details for two cities, London and Paris, with the following columns:
The two datasets have been added to Azure Machine Learning Studio as separate datasets and included as the starting point of the experiment.
Dataset issues
The AccessibilityToHighway column in both datasets contains missing values. The missing data must be replaced with new data so that it is modeled conditionally using the other variables in the data before filling in the missing values.
Columns in each dataset contain missing and null values. The dataset also contains many outliers. The Age column has a high proportion of outliers. You need to remove the rows that have outliers in the Age column. The MedianValue and AvgRoomsinHouse columns both hold data in numeric format. You need to select a feature selection algorithm to analyze the relationship between the two columns in more detail.
Model fit
The model shows signs of overfitting. You need to produce a more refined regression model that reduces the overfitting.
Experiment requirements
You must set up the experiment to cross-validate the Linear Regression and Bayesian Linear Regression modules to evaluate performance.
In each case, the predictor of the dataset is the column named MedianValue. An initial investigation showed that the datasets are identical in structure apart from the MedianValue column. The smaller Paris dataset contains the MedianValue in text format, whereas the larger London dataset contains the MedianValue in numerical format. You must ensure that the datatype of the MedianValue column of the Paris dataset matches the structure of the London dataset.
You must prioritize the columns of data for predicting the outcome. You must use non-parameters statistics to measure the relationships.
You must use a feature selection algorithm to analyze the relationship between the MedianValue and AvgRoomsinHouse columns.
Model training
Given a trained model and a test dataset, you need to compute the permutation feature importance scores of feature variables. You need to set up the Permutation Feature Importance module to select the correct metric to investigate the model's accuracy and replicate the findings.
You want to configure hyperparameters in the model learning process to speed the learning phase by using hyperparameters. In addition, this configuration should cancel the lowest performing runs at each evaluation interval, thereby directing effort and resources towards models that are more likely to be successful.
You are concerned that the model might not efficiently use compute resources in hyperparameter tuning. You also are concerned that the model might prevent an increase in the overall tuning time. Therefore, you need to implement an early stopping criterion on models that provides savings without terminating promising jobs.
Testing
You must produce multiple partitions of a dataset based on sampling using the Partition and Sample module in Azure Machine Learning Studio. You must create three equal partitions for cross-validation. You must also configure the cross-validation process so that the rows in the test and training datasets are divided evenly by properties that are near each city's main river. The data that identifies that a property is near a river is held in the column named NextToRiver. You want to complete this task before the data goes through the sampling process.
When you train a Linear Regression module using a property dataset that shows data for property prices for a large city, you need to determine the best features to use in a model. You can choose standard metrics provided to measure performance before and after the feature importance process completes. You must ensure that the distribution of the features across multiple training models is consistent.
Data visualization
You need to provide the test results to the Fabrikam Residences team. You create data visualizations to aid in presenting the results.
You must produce a Receiver Operating Characteristic (ROC) curve to conduct a diagnostic test evaluation of the model. You need to select appropriate methods for producing the ROC curve in Azure Machine Learning Studio to compare the Two-Class Decision Forest and the Two-Class Decision Jungle modules with one another.
質問 # 234
You create an Azure Machine Learning workspace and a dataset. The dataset includes age values for a large group of diabetes patients. You use the dp.mean function from the SmartNoise library to calculate the mean of the age value. You store the value in a variable named age.mean.
You must output the value of the interval range of released mean values that will be returned 95 percent of the time.
You need to complete the code.
Which code values should you use? To answer, select the appropriate options in the answer area NOTE: Each correct selection is worth one point.
正解:
解説:
Explanation:
To complete the code to output the value of the interval range of released mean values that will be returned 95 percent of the time using the SmartNoise library, you would need to use the privacy_usage_to_accuracy method with a value of 0.95 for the interval percentage. The dp.mean function from the SmartNoise library can return this interval when the required methods and parameters are used correctly.
print(age_mean.privacy_usage_to_accuracy(0.95))
* age_mean is the variable that holds the differentially private mean value calculated using the dp.mean function.
* privacy_usage_to_accuracy(0.95) method is called on age_mean to get the interval range for 95% confidence.
Therefore, the selections should be:
* privacy_usage_to_accuracy
* 0.95
This will give you the interval range of released mean values that will be returned 95 percent of the time.
質問 # 235
You are preparing to build a deep learning convolutional neural network model for image classification. You create a script to train the model using CUDA devices.
You must submit an experiment that runs this script in the Azure Machine Learning workspace.
The following compute resources are available:
a Microsoft Surface device on which Microsoft Office has been installed. Corporate IT policies prevent the installation of additional software a Compute Instance named ds-workstation in the workspace with 2 CPUs and 8 GB of memory an Azure Machine Learning compute target named cpu-cluster with eight CPU-based nodes an Azure Machine Learning compute target named gpu-cluster with four CPU and GPU-based nodes You need to specify the compute resources to be used for running the code to submit the experiment, and for running the script in order to minimize model training time.
Which resources should the data scientist use? To answer, select the appropriate options in the answer area.
NOTE: Each correct selection is worth one point.
正解:
解説:
Explanation:
Topic 1, Case Study 2
Case study
Overview
You are a data scientist for Fabrikam Residences, a company specializing in quality private and commercial property in the United States. Fabrikam Residences is considering expanding into Europe and has asked you to investigate prices for private residences in major European cities. You use Azure Machine Learning Studio to measure the median value of properties. You produce a regression model to predict property prices by using the Linear Regression and Bayesian Linear Regression modules.
Datasets
There are two datasets in CSV format that contain property details for two cities, London and Paris, with the following columns:
The two datasets have been added to Azure Machine Learning Studio as separate datasets and included as the starting point of the experiment.
Dataset issues
The AccessibilityToHighway column in both datasets contains missing values. The missing data must be replaced with new data so that it is modeled conditionally using the other variables in the data before filling in the missing values.
Columns in each dataset contain missing and null values. The dataset also contains many outliers. The Age column has a high proportion of outliers. You need to remove the rows that have outliers in the Age column.
The MedianValue and AvgRoomsinHouse columns both hold data in numeric format. You need to select a feature selection algorithm to analyze the relationship between the two columns in more detail.
Model fit
The model shows signs of overfitting. You need to produce a more refined regression model that reduces the overfitting.
Experiment requirements
You must set up the experiment to cross-validate the Linear Regression and Bayesian Linear Regression modules to evaluate performance.
In each case, the predictor of the dataset is the column named MedianValue. An initial investigation showed that the datasets are identical in structure apart from the MedianValue column. The smaller Paris dataset contains the MedianValue in text format, whereas the larger London dataset contains the MedianValue in numerical format. You must ensure that the datatype of the MedianValue column of the Paris dataset matches the structure of the London dataset.
You must prioritize the columns of data for predicting the outcome. You must use non-parameters statistics to measure the relationships.
You must use a feature selection algorithm to analyze the relationship between the MedianValue and AvgRoomsinHouse columns.
Model training
Given a trained model and a test dataset, you need to compute the permutation feature importance scores of feature variables. You need to set up the Permutation Feature Importance module to select the correct metric to investigate the model's accuracy and replicate the findings.
You want to configure hyperparameters in the model learning process to speed the learning phase by using hyperparameters. In addition, this configuration should cancel the lowest performing runs at each evaluation interval, thereby directing effort and resources towards models that are more likely to be successful.
You are concerned that the model might not efficiently use compute resources in hyperparameter tuning. You also are concerned that the model might prevent an increase in the overall tuning time. Therefore, you need to implement an early stopping criterion on models that provides savings without terminating promising jobs.
Testing
You must produce multiple partitions of a dataset based on sampling using the Partition and Sample module in Azure Machine Learning Studio. You must create three equal partitions for cross-validation. You must also configure the cross-validation process so that the rows in the test and training datasets are divided evenly by properties that are near each city's main river. The data that identifies that a property is near a river is held in the column named NextToRiver. You want to complete this task before the data goes through the sampling process.
When you train a Linear Regression module using a property dataset that shows data for property prices for a large city, you need to determine the best features to use in a model. You can choose standard metrics provided to measure performance before and after the feature importance process completes. You must ensure that the distribution of the features across multiple training models is consistent.
Data visualization
You need to provide the test results to the Fabrikam Residences team. You create data visualizations to aid in presenting the results.
You must produce a Receiver Operating Characteristic (ROC) curve to conduct a diagnostic test evaluation of the model. You need to select appropriate methods for producing the ROC curve in Azure Machine Learning Studio to compare the Two-Class Decision Forest and the Two-Class Decision Jungle modules with one another.
質問 # 236
You have several machine learning models registered in an Azure Machine Learning workspace.
You must use the Fairlearn dashboard to assess fairness in a selected model.
Which three actions should you perform in sequence? To answer, move the appropriate actions from the list of actions to the answer area and arrange them in the correct order.
正解:
解説:
Explanation:
Step 1: Select a model feature to be evaluated.
Step 2: Select a binary classification or regression model.
Register your models within Azure Machine Learning. For convenience, store the results in a dictionary, which maps the id of the registered model (a string in name:version format) to the predictor itself.
Example:
model_dict = {}
lr_reg_id = register_model("fairness_logistic_regression", lr_predictor) model_dict[lr_reg_id] = lr_predictor svm_reg_id = register_model("fairness_svm", svm_predictor) model_dict[svm_reg_id] = svm_predictor Step 3: Select a metric to be measured Precompute fairness metrics.
Create a dashboard dictionary using Fairlearn's metrics package.
ence:
https://docs.microsoft.com/en-us/azure/machine-learning/how-to-machine-learning-fairness-aml
質問 # 237
You are performing feature scaling by using the scikit-learn Python library for x.1 x2, and x3 features.
Original and scaled data is shown in the following image.
Use the drop-down menus to select the answer choice that answers each question based on the information presented in the graphic.
NOTE: Each correct selection is worth one point.
正解:
解説:
Reference:
http://benalexkeen.com/feature-scaling-with-scikit-learn/
質問 # 238
You have several machine learning models registered in an Azure Machine Learning workspace.
You must use the Fairlearn dashboard to assess fairness in a selected model.
Which three actions should you perform in sequence? To answer, move the appropriate actions from the list of actions to the answer area and arrange them in the correct order.
正解:
解説:
Explanation
Graphical user interface, text, application Description automatically generated
Step 1: Select a model feature to be evaluated.
Step 2: Select a binary classification or regression model.
Register your models within Azure Machine Learning. For convenience, store the results in a dictionary, which maps the id of the registered model (a string in name:version format) to the predictor itself.
Example:
model_dict = {}
lr_reg_id = register_model("fairness_logistic_regression", lr_predictor) model_dict[lr_reg_id] = lr_predictor svm_reg_id = register_model("fairness_svm", svm_predictor) model_dict[svm_reg_id] = svm_predictor Step 3: Select a metric to be measured Precompute fairness metrics.
Create a dashboard dictionary using Fairlearn's metrics package.
Reference:
https://docs.microsoft.com/en-us/azure/machine-learning/how-to-machine-learning-fairness-aml
質問 # 239
You use Data Science Virtual Machines (DSVMs) for Windows and Linux in Azure.
You need to access the DSVMs.
Which utilities should you use? To answer, select the appropriate options in the answer area.
NOTE: Each correct selection is worth one point.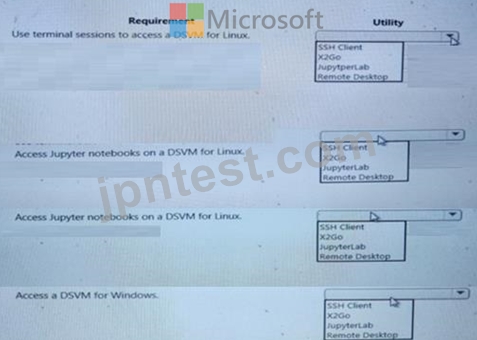
正解:
解説:
質問 # 240
Your team is building a data engineering and data science development environment.
The environment must support the following requirements:
support Python and Scala
compose data storage, movement, and processing services into automated data pipelines the same tool should be used for the orchestration of both data engineering and data science support workload isolation and interactive workloads enable scaling across a cluster of machines You need to create the environment.
What should you do?
- A. Build the environment in Apache Spark for HDInsight and use Azure Container Instances for orchestration.
- B. Build the environment in Azure Databricks and use Azure Data Factory for orchestration.
- C. Build the environment in Azure Databricks and use Azure Container Instances for orchestration.
- D. Build the environment in Apache Hive for HDInsight and use Azure Data Factory for orchestration.
正解:B
解説:
In Azure Databricks, we can create two different types of clusters.
Standard, these are the default clusters and can be used with Python, R, Scala and SQL High-concurrency Azure Databricks is fully integrated with Azure Data Factory.
Incorrect Answers:
D: Azure Container Instances is good for development or testing. Not suitable for production workloads.
References:
https://docs.microsoft.com/en-us/azure/architecture/data-guide/technology-choices/data-science-and-machinelearning
質問 # 241
You create an Azure Machine Learning dataset. You use the Azure Machine Learning designer to transform the dataset by using an Execute Python Script component and custom code.
You must upload the script and associated libraries as a script bundle.
You need to configure the Execute Python Script component.
Which configurations should you use? To answer, select the appropriate options in the answer area.
NOTE Each correct selection is worth one point.
正解:
解説:
Explanation
質問 # 242
Drag and Drop Question
You are analyzing a raw dataset that requires cleaning.
You must perform transformations and manipulations by using Azure Machine Learning Studio.
You need to identify the correct modules to perform the transformations.
Which modules should you choose? To answer, drag the appropriate modules to the correct scenarios. Each module may be used once, more than once, or not at all.
You may need to drag the split bar between panes or scroll to view content.
NOTE: Each correct selection is worth one point.
正解:
解説:
Explanation:
Box 1: Clean Missing Data
Box 2: SMOTE
Use the SMOTE module in Azure Machine Learning Studio to increase the number of underepresented cases in a dataset used for machine learning. SMOTE is a better way of increasing the number of rare cases than simply duplicating existing cases.
Box 3: Convert to Indicator Values
Use the Convert to Indicator Values module in Azure Machine Learning Studio. The purpose of this module is to convert columns that contain categorical values into a series of binary indicator columns that can more easily be used as features in a machine learning model.
Box 4: Remove Duplicate Rows
References:
https://docs.microsoft.com/en-us/azure/machine-learning/studio-module-reference/smote
https://docs.microsoft.com/en-us/azure/machine-learning/studio-module-reference/convert-to- indicator-values
質問 # 243
You have an Azure Machine learning workspace. The workspace contains a dataset with data in a tabular form.
You plan to use the Azure Machine Learning SDK for Python vl to create a control script that will load the dataset into a pandas dataframe in preparation for model training The script will accept a parameter designating the dataset You need to complete the script.
How should you complete the script? To answer, select the appropriate options in the answer area.
NOTE: Each correct selection is worth one point.
正解:
解説:
質問 # 244
You are creating data wrangling and model training solutions in an Azure Machine Learning workspace.
You must use the same Python notebook to perform both data wrangling and model training.
You need to use the Azure Machine Learning Python SDK v2 to define and configure the Synapse Spark pool asynchronously in the workspace as dedicated compute How should you complete the rode segment? To answer, select the appropriate options in the answer area.
NOTE: Lach correct selection is worth one point.
正解:
解説: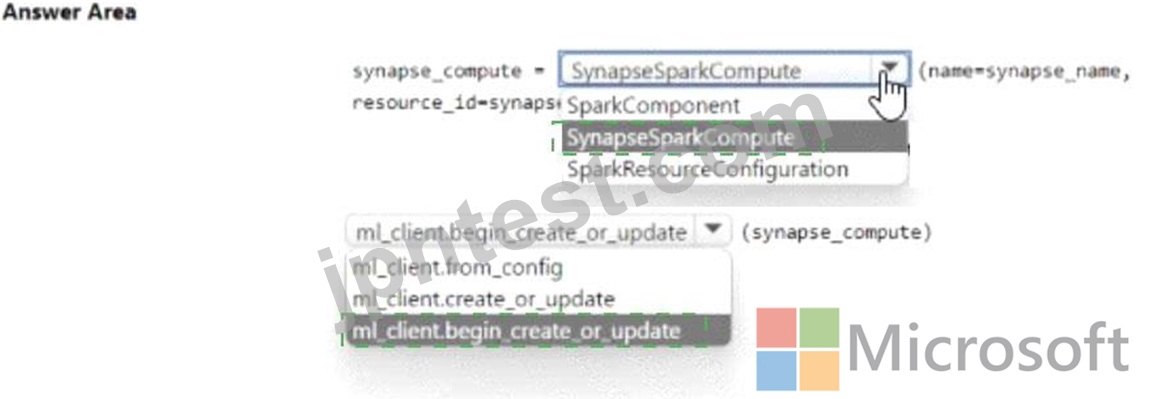
Explanation:
質問 # 245
Your Azure Machine Learning workspace has a dataset named . A sample of the data in the dataset follows.
You want to use automated machine learning to find the best regression model for predicting the price column.
You need to configure an automated machine learning experiment using the Azure Machine Learning SDK.
How should you complete the code? To answer, select the appropriate options in the answer area.
NOTE: Each correct selection is worth one point.
正解:
解説:
Explanation
Box 1: training_data
The training data to be used within the experiment. It should contain both training features and a label column (optionally a sample weights column). If training_data is specified, then the label_column_name parameter must also be specified.
Box 2: validation_data
Provide validation data: In this case, you can either start with a single data file and split it into training and validation sets or you can provide a separate data file for the validation set. Either way, the validation_data parameter in your AutoMLConfig object assigns which data to use as your validation set.
Example, the following code example explicitly defines which portion of the provided data in dataset to use for training and validation.
dataset = Dataset.Tabular.from_delimited_files(data)
training_data, validation_data = dataset.random_split(percentage=0.8, seed=1) automl_config = AutoMLConfig(compute_target = aml_remote_compute, task = 'classification', primary_metric = 'AUC_weighted', training_data = training_data, validation_data = validation_data, label_column_name = 'Class' ) Box 3: label_column_name label_column_name:
The name of the label column. If the input data is from a pandas.DataFrame which doesn't have column names, column indices can be used instead, expressed as integers.
This parameter is applicable to training_data and validation_data parameters.
Reference:
https://docs.microsoft.com/en-us/python/api/azureml-train-automl-client/azureml.train.automl.automlconfig.auto
質問 # 246
You create an Azure Machine Learning workspace.
You need to detect data drift between a baseline dataset and a subsequent target dataset by using the DataDriftDetector class.
How should you complete the code segment? To answer, select the appropriate options in the answer area.
NOTE: Each correct selection is worth one point.
正解:
解説:
Reference:
https://docs.microsoft.com/en-us/python/api/azureml-datadrift/azureml.datadrift.datadriftdetector(class)
Topic 2, Overview
Current environment
Requirements
* Media used for penalty event detection will be provided by consumer devices. Media may include images and videos captured during the sporting event and snared using social media. The images and videos will have varying sizes and formats.
* The data available for model building comprises of seven years of sporting event media. The sporting event media includes: recorded videos, transcripts of radio commentary, and logs from related social media feeds feeds captured during the sporting events.
* Crowd sentiment will include audio recordings submitted by event attendees in both mono and stereo Formats.
Advertisements
* Ad response models must be trained at the beginning of each event and applied during the sporting event.
* Market segmentation nxxlels must optimize for similar ad resporr.r history.
* Sampling must guarantee mutual and collective exclusivity local and global segmentation models that share the same features.
* Local market segmentation models will be applied before determining a user's propensity to respond to an advertisement.
* Data scientists must be able to detect model degradation and decay.
* Ad response models must support non linear boundaries features.
* The ad propensity model uses a cut threshold is 0.45 and retrains occur if weighted Kappa deviates from 0.1 +/-5%.
* The ad propensity model uses cost factors shown in the following diagram:
The ad propensity model uses proposed cost factors shown in the following diagram:
Performance curves of current and proposed cost factor scenarios are shown in the following diagram: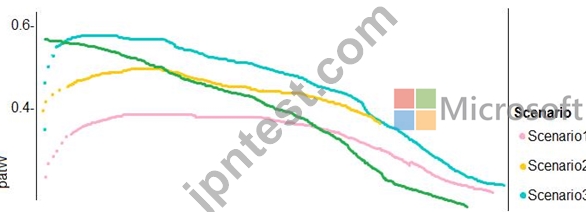
Penalty detection and sentiment
Findings
* Data scientists must build an intelligent solution by using multiple machine learning models for penalty event detection.
* Data scientists must build notebooks in a local environment using automatic feature engineering and model building in machine learning pipelines.
* Notebooks must be deployed to retrain by using Spark instances with dynamic worker allocation
* Notebooks must execute with the same code on new Spark instances to recode only the source of the data.
* Global penalty detection models must be trained by using dynamic runtime graph computation during training.
* Local penalty detection models must be written by using BrainScript.
* Experiments for local crowd sentiment models must combine local penalty detection data.
* Crowd sentiment models must identify known sounds such as cheers and known catch phrases. Individual crowd sentiment models will detect similar sounds.
* All shared features for local models are continuous variables.
* Shared features must use double precision. Subsequent layers must have aggregate running mean and standard deviation metrics Available.
segments
During the initial weeks in production, the following was observed:
* Ad response rates declined.
* Drops were not consistent across ad styles.
* The distribution of features across training and production data are not consistent.
Analysis shows that of the 100 numeric features on user location and behavior, the 47 features that come from location sources are being used as raw features. A suggested experiment to remedy the bias and variance issue is to engineer 10 linearly uncorrected features.
Penalty detection and sentiment
* Initial data discovery shows a wide range of densities of target states in training data used for crowd sentiment models.
* All penalty detection models show inference phases using a Stochastic Gradient Descent (SGD) are running too stow.
* Audio samples show that the length of a catch phrase varies between 25%-47%, depending on region.
* The performance of the global penalty detection models show lower variance but higher bias when comparing training and validation sets. Before implementing any feature changes, you must confirm the bias and variance using all training and validation cases.
質問 # 247
......
Microsoft DP-100テストエンジンPDFで全問 無料問題集:https://www.jpntest.com/shiken/DP-100-mondaishu
手に入れよう!最新DP-100認定有効な試験問題集解答:https://drive.google.com/open?id=1gPTYiNDJvKGztX9ub_N3M_w68WPS944T