

合格させるDatabricks Databricks-Certified-Data-Analyst-AssociateにはJPNTest提供の試験問題集で2024年07月更新
完全版最新のDatabricks-Certified-Data-Analyst-Associate問題集、100%カバー率問題と解答があなたをリアル試験で合格させる
質問 # 22
A data analysis team is working with the table_bronze SQL table as a source for one of its most complex projects. A stakeholder of the project notices that some of the downstream data is duplicative. The analysis team identifies table_bronze as the source of the duplication.
Which of the following queries can be used to deduplicate the data from table_bronze and write it to a new table table_silver?
A)
CREATE TABLE table_silver AS
SELECT DISTINCT *
FROM table_bronze;
B)
CREATE TABLE table_silver AS
INSERT *
FROM table_bronze;
C)
CREATE TABLE table_silver AS
MERGE DEDUPLICATE *
FROM table_bronze;
D)
INSERT INTO TABLE table_silver
SELECT * FROM table_bronze;
E)
INSERT OVERWRITE TABLE table_silver
SELECT * FROM table_bronze;
- A. Option D
- B. Option B
- C. Option C
- D. Option A
- E. Option E
正解:D
解説:
Option A uses the SELECT DISTINCT statement to remove duplicate rows from the table_bronze and create a new table table_silver with the deduplicated data. This is the correct way to deduplicate data using Spark SQL12. Option B simply inserts all the rows from table_bronze into table_silver, without removing any duplicates. Option C is not a valid syntax for Spark SQL, as there is no MERGE DEDUPLICATE statement. Option D appends all the rows from table_bronze into table_silver, without removing any duplicates. Option E overwrites the existing data in table_silver with the data from table_bronze, without removing any duplicates. Reference: Delete Duplicate using SPARK SQL, Spark SQL - How to Remove Duplicate Rows
質問 # 23
The stakeholders.customers table has 15 columns and 3,000 rows of data. The following command is run:
After running SELECT * FROM stakeholders.eur_customers, 15 rows are returned. After the command executes completely, the user logs out of Databricks.
After logging back in two days later, what is the status of the stakeholders.eur_customers view?
- A. The view remains available but attempting to SELECT from it results in an empty result set because data in views are automatically deleted after logging out.
- B. The view has been dropped.
- C. The view is not available in the metastore, but the underlying data can be accessed with SELECT * FROM delta. `stakeholders.eur_customers`.
- D. The view has been converted into a table.
- E. The view remains available and SELECT * FROM stakeholders.eur_customers will execute correctly.
正解:B
解説:
The command you sent creates a TEMP VIEW, which is a type of view that is only visible and accessible to the session that created it. When the session ends or the user logs out, the TEMP VIEW is automatically dropped and cannot be queried anymore. Therefore, after logging back in two days later, the status of the stakeholders.eur_customers view is that it has been dropped and SELECT * FROM stakeholders.eur_customers will result in an error. The other options are not correct because:
A) The view does not remain available, as it is a TEMP VIEW that is dropped when the session ends or the user logs out.
C) The view is not available in the metastore, as it is a TEMP VIEW that is not registered in the metastore. The underlying data cannot be accessed with SELECT * FROM delta. stakeholders.eur_customers, as this is not a valid syntax for querying a Delta Lake table. The correct syntax would be SELECT * FROM delta.dbfs:/stakeholders/eur_customers, where the location path is enclosed in backticks. However, this would also result in an error, as the TEMP VIEW does not write any data to the file system and the location path does not exist.
D) The view does not remain available, as it is a TEMP VIEW that is dropped when the session ends or the user logs out. Data in views are not automatically deleted after logging out, as views do not store any data. They are only logical representations of queries on base tables or other views.
E) The view has not been converted into a table, as there is no automatic conversion between views and tables in Databricks. To create a table from a view, you need to use a CREATE TABLE AS statement or a similar command. Reference: CREATE VIEW | Databricks on AWS, Solved: How do temp views actually work? - Databricks - 20136, temp tables in Databricks - Databricks - 44012, Temporary View in Databricks - BIG DATA PROGRAMMERS, Solved: What is the difference between a Temporary View an ...
質問 # 24
Which of the following is an advantage of using a Delta Lake-based data lakehouse over common data lake solutions?
- A. Scalable storage
- B. Open-source formats
- C. ACID transactions
- D. Data deletion
- E. Flexible schemas
正解:C
解説:
A Delta Lake-based data lakehouse is a data platform architecture that combines the scalability and flexibility of a data lake with the reliability and performance of a data warehouse. One of the key advantages of using a Delta Lake-based data lakehouse over common data lake solutions is that it supports ACID transactions, which ensure data integrity and consistency. ACID transactions enable concurrent reads and writes, schema enforcement and evolution, data versioning and rollback, and data quality checks. These features are not available in traditional data lakes, which rely on file-based storage systems that do not support transactions. Reference:
Delta Lake: Lakehouse, warehouse, advantages | Definition
Synapse - Data Lake vs. Delta Lake vs. Data Lakehouse
Data Lake vs. Delta Lake - A Detailed Comparison
Building a Data Lakehouse with Delta Lake Architecture: A Comprehensive Guide
質問 # 25
In which of the following situations should a data analyst use higher-order functions?
- A. When custom logic needs to be applied to simple, unnested data
- B. When built-in functions are taking too long to perform tasks
- C. When built-in functions need to run through the Catalyst Optimizer
- D. When custom logic needs to be applied at scale to array data objects
- E. When custom logic needs to be converted to Python-native code
正解:D
解説:
Higher-order functions are a simple extension to SQL to manipulate nested data such as arrays. A higher-order function takes an array, implements how the array is processed, and what the result of the computation will be. It delegates to a lambda function how to process each item in the array. This allows you to define functions that manipulate arrays in SQL, without having to unpack and repack them, use UDFs, or rely on limited built-in functions. Higher-order functions provide a performance benefit over user defined functions. Reference: Higher-order functions | Databricks on AWS, Working with Nested Data Using Higher Order Functions in SQL on Databricks | Databricks Blog, Higher-order functions - Azure Databricks | Microsoft Learn, Optimization recommendations on Databricks | Databricks on AWS
質問 # 26
A data analyst has been asked to provide a list of options on how to share a dashboard with a client. It is a security requirement that the client does not gain access to any other information, resources, or artifacts in the database.
Which of the following approaches cannot be used to share the dashboard and meet the security requirement?
- A. Generate a Personal Access Token that is good for 1 day and share it with the client.
- B. Set a refresh schedule for the dashboard and enter the client's email address in the "Subscribers" box.
- C. Download a PNG file of the visualizations in the dashboard and share them with the client.
- D. Take a screenshot of the dashboard and share it with the client.
- E. Download the Dashboard as a PDF and share it with the client.
正解:A
解説:
The approach that cannot be used to share the dashboard and meet the security requirement is D. Generating a Personal Access Token that is good for 1 day and sharing it with the client. This approach would give the client access to the Databricks workspace using the token owner's identity and permissions, which could expose other information, resources, or artifacts in the database1. The other approaches can be used to share the dashboard and meet the security requirement because:
A) Downloading the Dashboard as a PDF and sharing it with the client would only provide a static snapshot of the dashboard without any interactive features or access to the underlying data2.
B) Setting a refresh schedule for the dashboard and entering the client's email address in the "Subscribers" box would send the client an email with the latest dashboard results as an attachment or a link to a secure web page3. The client would not be able to access the Databricks workspace or the dashboard itself.
C) Taking a screenshot of the dashboard and sharing it with the client would also only provide a static snapshot of the dashboard without any interactive features or access to the underlying data4.
E) Downloading a PNG file of the visualizations in the dashboard and sharing them with the client would also only provide a static snapshot of the visualizations without any interactive features or access to the underlying data5. Reference:
1: Personal access tokens
2: Download as PDF
3: Automatically refresh a dashboard
4: Take a screenshot
5: Download a PNG file
質問 # 27
A data engineering team has created a Structured Streaming pipeline that processes data in micro-batches and populates gold-level tables. The microbatches are triggered every minute.
A data analyst has created a dashboard based on this gold-level data. The project stakeholders want to see the results in the dashboard updated within one minute or less of new data becoming available within the gold-level tables.
Which of the following cautions should the data analyst share prior to setting up the dashboard to complete this task?
- A. The streaming cluster is not fault tolerant
- B. The required compute resources could be costly
- C. The streaming data is not an appropriate data source for a dashboard
- D. The gold-level tables are not appropriately clean for business reporting
- E. The dashboard cannot be refreshed that quickly
正解:B
解説:
A Structured Streaming pipeline that processes data in micro-batches and populates gold-level tables every minute requires a high level of compute resources to handle the frequent data ingestion, processing, and writing. This could result in a significant cost for the organization, especially if the data volume and velocity are large. Therefore, the data analyst should share this caution with the project stakeholders before setting up the dashboard and evaluate the trade-offs between the desired refresh rate and the available budget. The other options are not valid cautions because:
B) The gold-level tables are assumed to be appropriately clean for business reporting, as they are the final output of the data engineering pipeline. If the data quality is not satisfactory, the issue should be addressed at the source or silver level, not at the gold level.
C) The streaming data is an appropriate data source for a dashboard, as it can provide near real-time insights and analytics for the business users. Structured Streaming supports various sources and sinks for streaming data, including Delta Lake, which can enable both batch and streaming queries on the same data.
D) The streaming cluster is fault tolerant, as Structured Streaming provides end-to-end exactly-once fault-tolerance guarantees through checkpointing and write-ahead logs. If a query fails, it can be restarted from the last checkpoint and resume processing.
E) The dashboard can be refreshed within one minute or less of new data becoming available in the gold-level tables, as Structured Streaming can trigger micro-batches as fast as possible (every few seconds) and update the results incrementally. However, this may not be necessary or optimal for the business use case, as it could cause frequent changes in the dashboard and consume more resources. Reference: Streaming on Databricks, Monitoring Structured Streaming queries on Databricks, A look at the new Structured Streaming UI in Apache Spark 3.0, Run your first Structured Streaming workload
質問 # 28
Which of the following benefits of using Databricks SQL is provided by Data Explorer?
- A. It can be used to produce dashboards that allow data exploration.
- B. It can be used to view metadata and data, as well as view/change permissions.
- C. It can be used to make visualizations that can be shared with stakeholders.
- D. It can be used to connect to third party Bl cools.
- E. It can be used to run UPDATE queries to update any tables in a database.
正解:B
解説:
Data Explorer is a user interface that allows you to discover and manage data, schemas, tables, models, and permissions in Databricks SQL. You can use Data Explorer to view schema details, preview sample data, and see table and model details and properties. Administrators can view and change owners, and admins and data object owners can grant and revoke permissions1. Reference: Discover and manage data using Data Explorer
質問 # 29
A data team has been given a series of projects by a consultant that need to be implemented in the Databricks Lakehouse Platform.
Which of the following projects should be completed in Databricks SQL?
- A. Testing the quality of data as it is imported from a source
- B. Combining two data sources into a single, comprehensive dataset
- C. Segmenting customers into like groups using a clustering algorithm
- D. Automating complex notebook-based workflows with multiple tasks
- E. Tracking usage of feature variables for machine learning projects
正解:B
解説:
Databricks SQL is a service that allows users to query data in the lakehouse using SQL and create visualizations and dashboards1. One of the common use cases for Databricks SQL is to combine data from different sources and formats into a single, comprehensive dataset that can be used for further analysis or reporting2. For example, a data analyst can use Databricks SQL to join data from a CSV file and a Parquet file, or from a Delta table and a JDBC table, and create a new table or view that contains the combined data3. This can help simplify the data management and governance, as well as improve the data quality and consistency. Reference:
Databricks SQL overview
Databricks SQL use cases
Joining data sources
質問 # 30
Which of the following should data analysts consider when working with personally identifiable information (PII) data?
- A. Legal requirements for the area in which the analysis is being performed
- B. Legal requirements for the area in which the data was collected
- C. Organization-specific best practices for Pll data
- D. All of these considerations
- E. None of these considerations
正解:D
解説:
Data analysts should consider all of these factors when working with PII data, as they may affect the data security, privacy, compliance, and quality. PII data is any information that can be used to identify a specific individual, such as name, address, phone number, email, social security number, etc. PII data may be subject to different legal and ethical obligations depending on the context and location of the data collection and analysis. For example, some countries or regions may have stricter data protection laws than others, such as the General Data Protection Regulation (GDPR) in the European Union. Data analysts should also follow the organization-specific best practices for PII data, such as encryption, anonymization, masking, access control, auditing, etc. These best practices can help prevent data breaches, unauthorized access, misuse, or loss of PII data. Reference:
How to Use Databricks to Encrypt and Protect PII Data
Automating Sensitive Data (PII/PHI) Detection
Databricks Certified Data Analyst Associate
質問 # 31
A data analyst runs the following command:
SELECT age, country
FROM my_table
WHERE age >= 75 AND country = 'canada';
Which of the following tables represents the output of the above command?
- A.

- B.

- C.

- D.

- E.

正解:A
解説:
The SQL query provided is designed to filter out records from "my_table" where the age is 75 or above and the country is Canada. Since I can't view the content of the links provided directly, I need to rely on the image attached to this question for context. Based on that, Option E (the image attached) represents a table with columns "age" and "country", showing records where age is 75 or above and country is Canada. Reference: The answer can be inferred from understanding SQL queries and their outputs as per Databricks documentation: Databricks SQL
質問 # 32
A data analyst has a managed table table_name in database database_name. They would now like to remove the table from the database and all of the data files associated with the table. The rest of the tables in the database must continue to exist.
Which of the following commands can the analyst use to complete the task without producing an error?
- A. DROP TABLE database_name.table_name;
- B. DROP DATABASE database_name;
- C. DROP TABLE table_name FROM database_name;
- D. DELETE TABLE database_name.table_name;
- E. DELETE TABLE table_name FROM database_name;
正解:A
解説:
The DROP TABLE command removes a table from the metastore and deletes the associated data files. The syntax for this command is DROP TABLE [IF EXISTS] [database_name.]table_name;. The optional IF EXISTS clause prevents an error if the table does not exist. The optional database_name. prefix specifies the database where the table resides. If not specified, the current database is used. Therefore, the correct command to remove the table table_name from the database database_name and all of the data files associated with it is DROP TABLE database_name.table_name;. The other commands are either invalid syntax or would produce undesired results. Reference: Databricks - DROP TABLE
質問 # 33
A data analyst creates a Databricks SQL Query where the result set has the following schema:
region STRING
number_of_customer INT
When the analyst clicks on the "Add visualization" button on the SQL Editor page, which of the following types of visualizations will be selected by default?
- A. There is no default. The user must choose a visualization type.
- B. Line Chart
- C. Violin Chart
- D. IBar Chart
- E. Histogram
正解:D
解説:
According to the Databricks SQL documentation, when a data analyst clicks on the "Add visualization" button on the SQL Editor page, the default visualization type is Bar Chart. This is because the result set has two columns: one of type STRING and one of type INT. The Bar Chart visualization automatically assigns the STRING column to the X-axis and the INT column to the Y-axis. The Bar Chart visualization is suitable for showing the distribution of a numeric variable across different categories. Reference: Visualization in Databricks SQL, Visualization types
質問 # 34
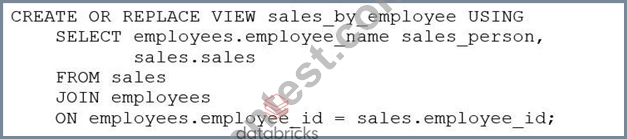
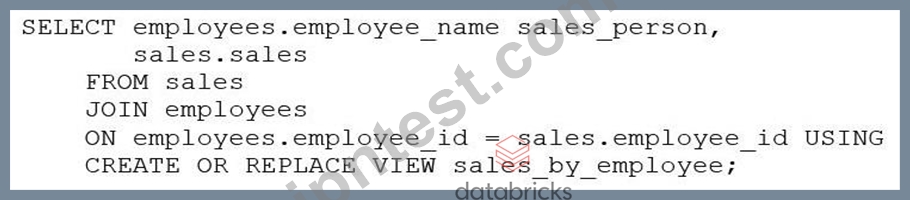
A business analyst has been asked to create a data entity/object called sales_by_employee. It should always stay up-to-date when new data are added to the sales table. The new entity should have the columns sales_person, which will be the name of the employee from the employees table, and sales, which will be all sales for that particular sales person. Both the sales table and the employees table have an employee_id column that is used to identify the sales person.
Which of the following code blocks will accomplish this task?
- A.
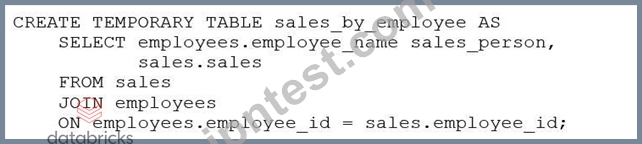
- B.
- C.
- D.

正解:D
解説:
The SQL code provided in Option D is the correct way to create a view named sales_by_employee that will always stay up-to-date with the sales and employees tables. The code uses the CREATE OR REPLACE VIEW statement to define a new view that joins the sales and employees tables on the employee_id column. It selects the employee_name as sales_person and all sales for each employee, ensuring that the data entity/object is always up-to-date when new data are added to these tables.
質問 # 35
A data analyst wants to create a dashboard with three main sections: Development, Testing, and Production. They want all three sections on the same dashboard, but they want to clearly designate the sections using text on the dashboard.
Which of the following tools can the data analyst use to designate the Development, Testing, and Production sections using text?
- A. Separate endpoints for each section
- B. Separate color palettes for each section
- C. Direct text written into the dashboard in editing mode
- D. Separate queries for each section
- E. Markdown-based text boxes
正解:E
解説:
Markdown-based text boxes are useful as labels on a dashboard. They allow the data analyst to add text to a dashboard using the %md magic command in a notebook cell and then select the dashboard icon in the cell actions menu. The text can be formatted using markdown syntax and can include headings, lists, links, images, and more. The text boxes can be resized and moved around on the dashboard using the float layout option. Reference: Dashboards in notebooks, How to add text to a dashboard in Databricks
質問 # 36
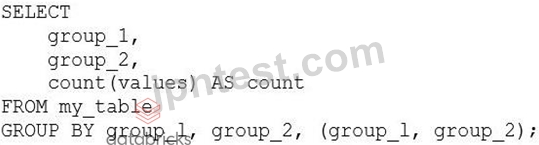
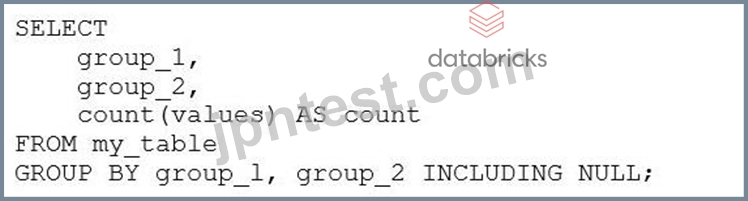
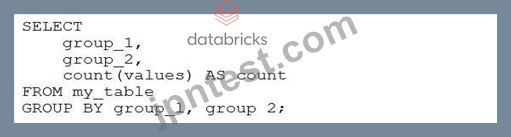
A data analyst is processing a complex aggregation on a table with zero null values and their query returns the following result: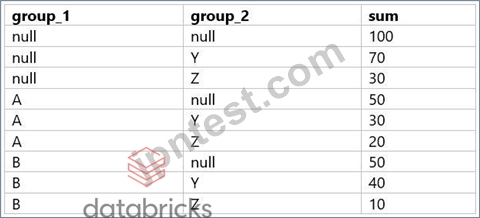
Which of the following queries did the analyst run to obtain the above result?
- A.
- B.

- C.
- D.

- E.
正解:B
解説:
The result set provided shows a combination of grouping by two columns (group_1 and group_2) with subtotals for each level of grouping and a grand total. This pattern is typical of a GROUP BY ... WITH ROLLUP operation in SQL, which provides subtotal rows and a grand total row in the result set.
Considering the query options:
A) Option A: GROUP BY group_1, group_2 INCLUDING NULL - This is not a standard SQL clause and would not result in subtotals and a grand total.
B) Option B: GROUP BY group_1, group_2 WITH ROLLUP - This would create subtotals for each unique group_1, each combination of group_1 and group_2, and a grand total, which matches the result set provided.
C) Option C: GROUP BY group_1, group 2 - This is a simple GROUP BY and would not include subtotals or a grand total.
D) Option D: GROUP BY group_1, group_2, (group_1, group_2) - This syntax is not standard and would likely result in an error or be interpreted as a simple GROUP BY, not providing the subtotals and grand total.
E) Option E: GROUP BY group_1, group_2 WITH CUBE - The WITH CUBE operation produces subtotals for all combinations of the selected columns and a grand total, which is more than what is shown in the result set.
The correct answer is Option B, which uses WITH ROLLUP to generate the subtotals for each level of grouping as well as a grand total. This matches the result set where we have subtotals for each group_1, each combination of group_1 and group_2, and the grand total where both group_1 and group_2 are NULL.
質問 # 37
How can a data analyst determine if query results were pulled from the cache?
- A. Go to the Alerts tab and check the Cache Status alert.
- B. Go to the Data tab and click Last Query. The details of the query will show if the results came from the cache.
- C. Go to the SQL Warehouse (formerly SQL Endpoints) tab and click on Cache. The Cache file will show the contents of the cache.
- D. Go to the Query History tab and click on the text of the query. The slideout shows if the results came from the cache.
- E. Go to the Queries tab and click on Cache Status. The status will be green if the results from the last run came from the cache.
正解:D
解説:
Databricks SQL uses a query cache to store the results of queries that have been executed previously. This improves the performance and efficiency of repeated queries. To determine if a query result was pulled from the cache, you can go to the Query History tab in the Databricks SQL UI and click on the text of the query. A slideout will appear on the right side of the screen, showing the query details, including the cache status. If the result came from the cache, the cache status will show "Cached". If the result did not come from the cache, the cache status will show "Not cached". You can also see the cache hit ratio, which is the percentage of queries that were served from the cache. Reference: The answer can be verified from Databricks SQL documentation which provides information on how to use the query cache and how to check the cache status. Reference link: Databricks SQL - Query Cache
質問 # 38
A data analyst has been asked to configure an alert for a query that returns the income in the accounts_receivable table for a date range. The date range is configurable using a Date query parameter.
The Alert does not work.
Which of the following describes why the Alert does not work?
- A. The wrong query parameter is being used. Alerts only work with drogdown list query parameters, not dates.
- B. Alerts don't work with queries that access tables.
- C. The wrong query parameter is being used. Alerts only work with Date and Time query parameters.
- D. Queries that return results based on dates cannot be used with Alerts.
- E. Queries that use query parameters cannot be used with Alerts.
正解:E
解説:
According to the Databricks documentation1, queries that use query parameters cannot be used with Alerts. This is because Alerts do not support user input or dynamic values. Alerts leverage queries with parameters using the default value specified in the SQL editor for each parameter. Therefore, if the query uses a Date query parameter, the alert will always use the same date range as the default value, regardless of the actual date. This may cause the alert to not work as expected, or to not trigger at all. Reference:
Databricks SQL alerts: This is the official documentation for Databricks SQL alerts, where you can find information about how to create, configure, and monitor alerts, as well as the limitations and best practices for using alerts.
質問 # 39
Data professionals with varying titles use the Databricks SQL service as the primary touchpoint with the Databricks Lakehouse Platform. However, some users will use other services like Databricks Machine Learning or Databricks Data Science and Engineering.
Which of the following roles uses Databricks SQL as a secondary service while primarily using one of the other services?
- A. Business analyst
- B. Data analyst
- C. Data engineer
- D. SQL analyst
- E. Business intelligence analyst
正解:C
解説:
Data engineers are primarily responsible for building, managing, and optimizing data pipelines and architectures. They use Databricks Data Science and Engineering service to perform tasks such as data ingestion, transformation, quality, and governance. Data engineers may use Databricks SQL as a secondary service to query, analyze, and visualize data from the lakehouse, but this is not their main focus. Reference: Databricks SQL overview, Databricks Data Science and Engineering overview, Data engineering with Databricks
質問 # 40
Which of the following statements about a refresh schedule is incorrect?
- A. A refresh schedule is not the same as an alert.
- B. You must have workspace administrator privileges to configure a refresh schedule
- C. Refresh schedules can be configured in the Query Editor.
- D. A query can be refreshed anywhere from 1 minute lo 2 weeks
- E. A query being refreshed on a schedule does not use a SQL Warehouse (formerly known as SQL Endpoint).
正解:E
解説:
Refresh schedules are used to rerun queries at specified intervals, and these queries typically require computational resources to execute. In the context of a cloud data service like Databricks, this would typically involve the use of a SQL Warehouse (or a SQL Endpoint, as they were formerly known) to provide the necessary computational resources. Therefore, the statement is incorrect because scheduled query refreshes would indeed use a SQL Warehouse/Endpoint to execute the query.
質問 # 41
......
最新Databricks-Certified-Data-Analyst-Associate試験問題集有効で最新の問題集:https://www.jpntest.com/shiken/Databricks-Certified-Data-Analyst-Associate-mondaishu
検証済みDatabricks-Certified-Data-Analyst-Associate試験解答合格確定させる:https://drive.google.com/open?id=1FRsB4NABUX0mC_KXpGUvo21T2g3aLa7J