

2024年最新の更新のData Analystが有効なDatabricks-Certified-Data-Analyst-Associate問題集を無料提供しています
最新のJPNTest Databricks-Certified-Data-Analyst-AssociatePDF問題集をダウンロードしちゃおう:https://www.jpntest.com/shiken/Databricks-Certified-Data-Analyst-Associate-mondaishu(47問題と解答)
質問 # 10
A data analyst needs to use the Databricks Lakehouse Platform to quickly create SQL queries and data visualizations. It is a requirement that the compute resources in the platform can be made serverless, and it is expected that data visualizations can be placed within a dashboard.
Which of the following Databricks Lakehouse Platform services/capabilities meets all of these requirements?
- A. Databricks SQL
- B. Delta Lake
- C. Databricks Notebooks
- D. Databricks Machine Learning
- E. Tableau
正解:A
解説:
Databricks SQL is a serverless data warehouse on the Lakehouse that lets you run all of your SQL and BI applications at scale with your tools of choice, all at a fraction of the cost of traditional cloud data warehouses1. Databricks SQL allows you to create SQL queries and data visualizations using the SQL Analytics UI or the Databricks SQL CLI2. You can also place your data visualizations within a dashboard and share it with other users in your organization3. Databricks SQL is powered by Delta Lake, which provides reliability, performance, and governance for your data lake4. Reference:
Databricks SQL
Query data using SQL Analytics
Visualizations in Databricks notebooks
Delta Lake
質問 # 11
A data analyst has created a Query in Databricks SQL, and now they want to create two data visualizations from that Query and add both of those data visualizations to the same Databricks SQL Dashboard.
Which of the following steps will they need to take when creating and adding both data visualizations to the Databricks SQL Dashboard?
- A. They will need to decide on a single data visualization to add to the dashboard.
- B. They will need to create two separate dashboards.
- C. They will need to add two separate visualizations to the dashboard based on the same Query.
- D. They will need to alter the Query to return two separate sets of results.
- E. They will need to copy the Query and create one data visualization per query.
正解:C
解説:
A data analyst can create multiple visualizations from the same query in Databricks SQL by clicking the + button next to the Results tab and selecting Visualization. Each visualization can have a different type, name, and configuration. To add a visualization to a dashboard, the data analyst can click the vertical ellipsis button beneath the visualization, select + Add to Dashboard, and choose an existing or new dashboard. The data analyst can repeat this process for each visualization they want to add to the same dashboard. Reference: Visualization in Databricks SQL, Visualize queries and create a dashboard in Databricks SQL
質問 # 12
A data analyst has been asked to use the below table sales_table to get the percentage rank of products within region by the sales: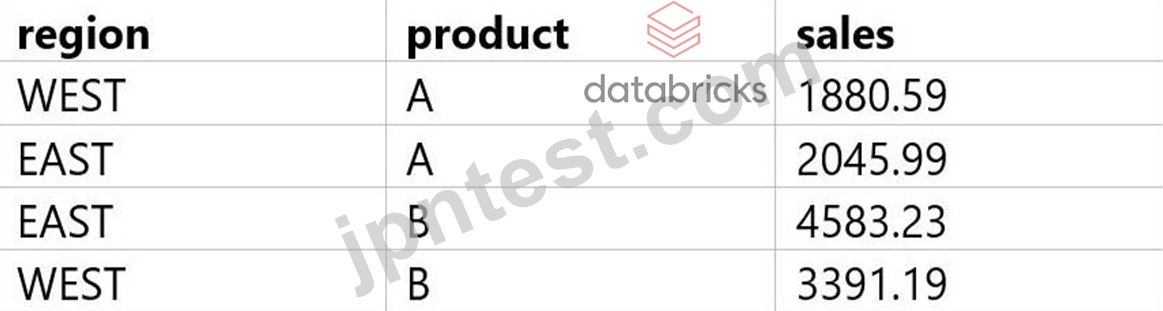
The result of the query should look like this: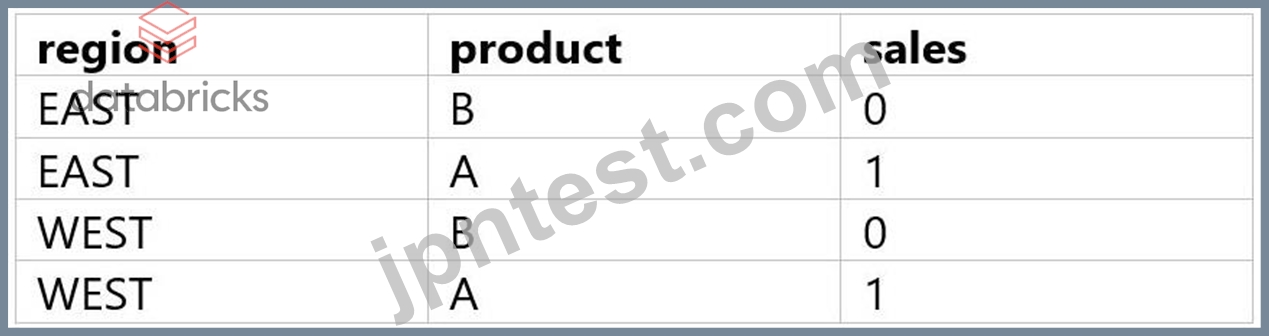
Which of the following queries will accomplish this task?
A)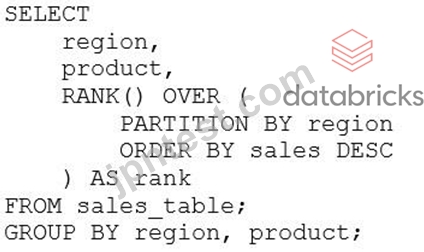
B)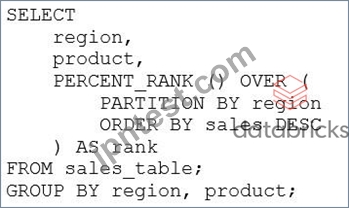
C)

- A. Option D
- B. Option A
- C. Option B
- D. Option C
正解:C
解説:
The correct query to get the percentage rank of products within region by the sales is option B. This query uses the PERCENT_RANK() window function to calculate the relative rank of each product within each region based on the sales amount. The window function is partitioned by region and ordered by sales in descending order. The result is aliased as rank and displayed along with the region and product columns. The other options are incorrect because:
A) Option A uses the RANK() window function instead of the PERCENT_RANK() function. The RANK() function returns the rank of each row within the partition, but not the percentage rank. Also, the query does not have a GROUP BY clause, which is required for aggregate functions like SUM().
C) Option C uses the DENSE_RANK() window function instead of the PERCENT_RANK() function. The DENSE_RANK() function returns the rank of each row within the partition, but not the percentage rank. Also, the query does not have a GROUP BY clause, which is required for aggregate functions like SUM().
D) Option D uses the ROW_NUMBER() window function instead of the PERCENT_RANK() function. The ROW_NUMBER() function returns the sequential number of each row within the partition, but not the percentage rank. Also, the query does not have a GROUP BY clause, which is required for aggregate functions like SUM(). Reference:
1: PERCENT_RANK (Transact-SQL)
2: Window functions in Databricks SQL
3: Databricks Certified Data Analyst Associate Exam Guide
質問 # 13
A data analyst is attempting to drop a table my_table. The analyst wants to delete all table metadata and data.
They run the following command:
DROP TABLE IF EXISTS my_table;
While the object no longer appears when they run SHOW TABLES, the data files still exist.
Which of the following describes why the data files still exist and the metadata files were deleted?
- A. The table did not have a location
- B. The table's data was smaller than 10 GB
- C. The table was managed
- D. The table was external
- E. The table's data was larger than 10 GB
正解:D
解説:
An external table is a table that is defined in the metastore, but its data is stored outside of the Databricks environment, such as in S3, ADLS, or GCS. When an external table is dropped, only the metadata is deleted from the metastore, but the data files are not affected. This is different from a managed table, which is a table whose data is stored in the Databricks environment, and whose data files are deleted when the table is dropped. To delete the data files of an external table, the analyst needs to specify the PURGE option in the DROP TABLE command, or manually delete the files from the storage system. Reference: DROP TABLE, Drop Delta table features, Best practices for dropping a managed Delta Lake table
質問 # 14
A data analyst is processing a complex aggregation on a table with zero null values and their query returns the following result: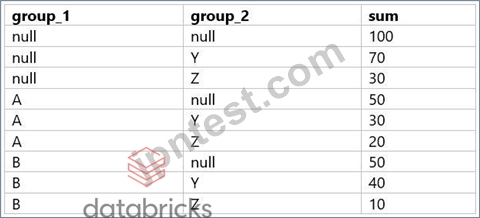
Which of the following queries did the analyst run to obtain the above result?
- A.
- B.

- C.
- D.

- E.
正解:D
解説:
The result set provided shows a combination of grouping by two columns (group_1 and group_2) with subtotals for each level of grouping and a grand total. This pattern is typical of a GROUP BY ... WITH ROLLUP operation in SQL, which provides subtotal rows and a grand total row in the result set.
Considering the query options:
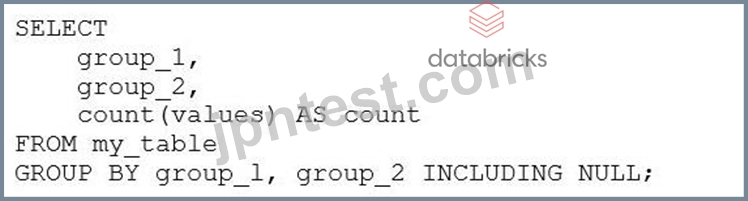
A) Option A: GROUP BY group_1, group_2 INCLUDING NULL - This is not a standard SQL clause and would not result in subtotals and a grand total.
B) Option B: GROUP BY group_1, group_2 WITH ROLLUP - This would create subtotals for each unique group_1, each combination of group_1 and group_2, and a grand total, which matches the result set provided.
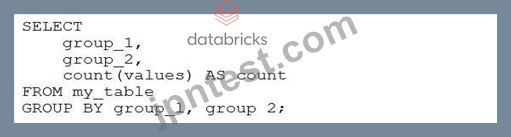
C) Option C: GROUP BY group_1, group 2 - This is a simple GROUP BY and would not include subtotals or a grand total.
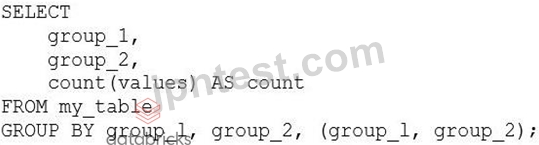
D) Option D: GROUP BY group_1, group_2, (group_1, group_2) - This syntax is not standard and would likely result in an error or be interpreted as a simple GROUP BY, not providing the subtotals and grand total.
E) Option E: GROUP BY group_1, group_2 WITH CUBE - The WITH CUBE operation produces subtotals for all combinations of the selected columns and a grand total, which is more than what is shown in the result set.
The correct answer is Option B, which uses WITH ROLLUP to generate the subtotals for each level of grouping as well as a grand total. This matches the result set where we have subtotals for each group_1, each combination of group_1 and group_2, and the grand total where both group_1 and group_2 are NULL.
質問 # 15
A data analyst has been asked to provide a list of options on how to share a dashboard with a client. It is a security requirement that the client does not gain access to any other information, resources, or artifacts in the database.
Which of the following approaches cannot be used to share the dashboard and meet the security requirement?
- A. Download the Dashboard as a PDF and share it with the client.
- B. Take a screenshot of the dashboard and share it with the client.
- C. Generate a Personal Access Token that is good for 1 day and share it with the client.
- D. Set a refresh schedule for the dashboard and enter the client's email address in the "Subscribers" box.
- E. Download a PNG file of the visualizations in the dashboard and share them with the client.
正解:C
解説:
The approach that cannot be used to share the dashboard and meet the security requirement is D. Generating a Personal Access Token that is good for 1 day and sharing it with the client. This approach would give the client access to the Databricks workspace using the token owner's identity and permissions, which could expose other information, resources, or artifacts in the database1. The other approaches can be used to share the dashboard and meet the security requirement because:
A) Downloading the Dashboard as a PDF and sharing it with the client would only provide a static snapshot of the dashboard without any interactive features or access to the underlying data2.
B) Setting a refresh schedule for the dashboard and entering the client's email address in the "Subscribers" box would send the client an email with the latest dashboard results as an attachment or a link to a secure web page3. The client would not be able to access the Databricks workspace or the dashboard itself.
C) Taking a screenshot of the dashboard and sharing it with the client would also only provide a static snapshot of the dashboard without any interactive features or access to the underlying data4.
E) Downloading a PNG file of the visualizations in the dashboard and sharing them with the client would also only provide a static snapshot of the visualizations without any interactive features or access to the underlying data5. Reference:
1: Personal access tokens
2: Download as PDF
3: Automatically refresh a dashboard
4: Take a screenshot
5: Download a PNG file
質問 # 16
Which of the following statements describes descriptive statistics?
- A. A branch of statistics that uses summary statistics to categorically describe and summarize data.
- B. A branch of statistics that uses summary statistics to quantitatively describe and summarize data.
- C. A branch of statistics that uses a variety of data analysis techniques to infer properties of an underlying distribution of probability.
- D. A branch of statistics that uses quantitative variables that must take on an uncountable set of values.
- E. A branch of statistics that uses quantitative variables that must take on a finite or countably infinite set of values.
正解:B
解説:
Descriptive statistics is a branch of statistics that uses summary statistics, such as mean, median, mode, standard deviation, range, frequency, or correlation, to quantitatively describe and summarize data. Descriptive statistics can help data analysts understand the main features of a data set, such as its central tendency, variability, or distribution. Descriptive statistics can also help data analysts visualize data using charts, graphs, or tables. Descriptive statistics do not make any inferences or predictions about the data, unlike inferential statistics, which use data analysis techniques to infer properties of an underlying population or probability distribution from a sample of data. Reference: Databricks - Descriptive Statistics, Databricks - Data Analysis with Databricks SQL
質問 # 17
Consider the following two statements:
Statement 1:
Statement 2:
Which of the following describes how the result sets will differ for each statement when they are run in Databricks SQL?
- A. When the first statement is run, only rows from the customers table that have at least one match with the orders table on customer_id will be returned. When the second statement is run, only those rows in the customers table that do not have at least one match with the orders table on customer_id will be returned.
- B. When the first statement is run, all rows from the customers table will be returned and only the customer_id from the orders table will be returned. When the second statement is run, only those rows in the customers table that do not have at least one match with the orders table on customer_id will be returned.
- C. Both statements will fail because Databricks SQL does not support those join types.
- D. There is no difference between the result sets for both statements.
- E. The first statement will return all data from the customers table and matching data from the orders table. The second statement will return all data from the orders table and matching data from the customers table. Any missing data will be filled in with NULL.
正解:A
解説:
Based on the images you sent, the two statements are SQL queries for different types of joins between the customers and orders tables. A join is a way of combining the rows from two table references based on some criteria. The join type determines how the rows are matched and what kind of result set is returned. The first statement is a query for a LEFT SEMI JOIN, which returns only the rows from the left table reference (customers) that have a match with the right table reference (orders) on the join condition (customer_id). The second statement is a query for a LEFT ANTI JOIN, which returns only the rows from the left table reference (customers) that have no match with the right table reference (orders) on the join condition (customer_id). Therefore, the result sets for the two statements will differ in the following way:
The first statement will return a subset of the customers table that contains only the customers who have placed at least one order. The number of rows returned will be less than or equal to the number of rows in the customers table, depending on how many customers have orders. The number of columns returned will be the same as the number of columns in the customers table, as the LEFT SEMI JOIN does not include any columns from the orders table.
The second statement will return a subset of the customers table that contains only the customers who have not placed any order. The number of rows returned will be less than or equal to the number of rows in the customers table, depending on how many customers have no orders. The number of columns returned will be the same as the number of columns in the customers table, as the LEFT ANTI JOIN does not include any columns from the orders table.
The other options are not correct because:
A) The first statement will not return all data from the customers table, as it will exclude the customers who have no orders. The second statement will not return all data from the orders table, as it will exclude the orders that have a matching customer. Neither statement will fill in any missing data with NULL, as they do not return any columns from the other table.
C) There is a difference between the result sets for both statements, as explained above. The LEFT SEMI JOIN and the LEFT ANTI JOIN are not equivalent operations and will produce different outputs.
D) Both statements will not fail, as Databricks SQL does support those join types. Databricks SQL supports various join types, including INNER, LEFT OUTER, RIGHT OUTER, FULL OUTER, LEFT SEMI, LEFT ANTI, and CROSS. You can also use NATURAL, USING, or LATERAL keywords to specify different join criteria.
E) The first statement will not return only the customer_id from the orders table, as it will return all columns from the customers table. The second statement is correct, but it is not the only difference between the result sets.
質問 # 18
A data analyst has recently joined a new team that uses Databricks SQL, but the analyst has never used Databricks before. The analyst wants to know where in Databricks SQL they can write and execute SQL queries.
On which of the following pages can the analyst write and execute SQL queries?
- A. Dashboards page
- B. Alerts page
- C. Data page
- D. SQL Editor page
- E. Queries page
正解:D
解説:
The SQL Editor page is where the analyst can write and execute SQL queries in Databricks SQL. The SQL Editor page has a query pane where the analyst can type or paste SQL statements, and a results pane where the analyst can view the query results in a table or a chart. The analyst can also browse data objects, edit multiple queries, execute a single query or multiple queries, terminate a query, save a query, download a query result, and more from the SQL Editor page. Reference: Create a query in SQL editor
質問 # 19
Which of the following is a benefit of Databricks SQL using ANSI SQL as its standard SQL dialect?
- A. It is more performant than other SQL dialects
- B. It allows for the use of Photon's computation optimizations
- C. It is easy to migrate existing SQL queries to Databricks SQL
- D. It has increased customization capabilities
- E. It is more compatible with Spark's interpreters
正解:C
解説:
Databricks SQL uses ANSI SQL as its standard SQL dialect, which means it follows the SQL specifications defined by the American National Standards Institute (ANSI). This makes it easier to migrate existing SQL queries from other data warehouses or platforms that also use ANSI SQL or a similar dialect, such as PostgreSQL, Oracle, or Teradata. By using ANSI SQL, Databricks SQL avoids surprises in behavior or unfamiliar syntax that may arise from using a non-standard SQL dialect, such as Spark SQL or Hive SQL12. Moreover, Databricks SQL also adds compatibility features to support common SQL constructs that are widely used in other data warehouses, such as QUALIFY, FILTER, and user-defined functions2. Reference: ANSI compliance in Databricks Runtime, Evolution of the SQL language at Databricks: ANSI standard by default and easier migrations from data warehouses
質問 # 20
A data analyst has been asked to count the number of customers in each region and has written the following query:
If there is a mistake in the query, which of the following describes the mistake?
- A. The query is using ORDER BY. which is not allowed in an aggregation.
- B. The query is selecting region but region should only occur in the ORDER BY clause.
- C. There are no mistakes in the query.
- D. The query is missing a GROUP BY region clause.
- E. The query is using count('). which will count all the customers in the customers table, no matter the region.
正解:D
解説:
In the provided SQL query, the data analyst is trying to count the number of customers in each region. However, they made a mistake by not including the "GROUP BY" clause to group the results by region. Without this clause, the query will not return counts for each distinct region but rather an error or incorrect result. Reference: The need for a GROUP BY clause in such queries can be understood from Databricks SQL documentation: Databricks SQL.
I also noticed that you uploaded an image with your question. The image shows a snippet of an SQL query written in plain text on a white background. The query is attempting to select regions and count customers from a "customers" table and order the results by region. There's no visible syntax highlighting or any other color - it's monochromatic. The query is the same as the one in your question. I'm not sure why you included the image, but maybe you wanted to show me the exact format of your query. If so, you can also use code blocks to display formatted content such as SQL queries. For example, you can write:
SELECT region, count(*) AS number_of_customers
FROM customers
ORDER BY region;
This way, you can avoid uploading images and make your questions more clear and concise. I hope this helps.
質問 # 21
Which of the following describes how Databricks SQL should be used in relation to other business intelligence (BI) tools like Tableau, Power BI, and looker?
- A. As an exact substitute with the same level of functionality
- B. As a complementary tool for professional-grade presentations
- C. As a complementary tool for quick in-platform Bl work
- D. As a substitute with less functionality
- E. As a complete replacement with additional functionality
正解:C
解説:
Databricks SQL is not meant to replace or substitute other BI tools, but rather to complement them by providing a fast and easy way to query, explore, and visualize data on the lakehouse using the built-in SQL editor, visualizations, and dashboards. Databricks SQL also integrates seamlessly with popular BI tools like Tableau, Power BI, and Looker, allowing analysts to use their preferred tools to access data through Databricks clusters and SQL warehouses. Databricks SQL offers low-code and no-code experiences, as well as optimized connectors and serverless compute, to enhance the productivity and performance of BI workloads on the lakehouse. Reference: Databricks SQL, Connecting Applications and BI Tools to Databricks SQL, Databricks integrations overview, Databricks SQL: Delivering a Production SQL Development Experience on the Lakehouse
質問 # 22
A data analyst runs the following command:
INSERT INTO stakeholders.suppliers TABLE stakeholders.new_suppliers;
What is the result of running this command?
- A. The suppliers table now contains only the data from the new suppliers table.
- B. The suppliers table now contains both the data it had before the command was run and the data from the new suppliers table, including any duplicate data.
- C. The suppliers table now contains both the data it had before the command was run and the data from the new suppliers table, and any duplicate data is deleted.
- D. The command fails because it is written incorrectly.
- E. The suppliers table now contains the data from the new suppliers table, and the new suppliers table now contains the data from the suppliers table.
正解:D
解説:
The command INSERT INTO stakeholders.suppliers TABLE stakeholders.new_suppliers is not a valid syntax for inserting data into a table in Databricks SQL. According to the documentation12, the correct syntax for inserting data into a table is either:
INSERT { OVERWRITE | INTO } [ TABLE ] table_name [ PARTITION clause ] [ ( column_name [, ...] ) | BY NAME ] query INSERT INTO [ TABLE ] table_name REPLACE WHERE predicate query The command in the question is missing the OVERWRITE or INTO keyword, and the query part that specifies the source of the data to be inserted. The TABLE keyword is optional and can be omitted. The PARTITION clause and the column list are also optional and depend on the table schema and the data source. Therefore, the command in the question will fail with a syntax error.
Reference:
INSERT | Databricks on AWS
INSERT - Azure Databricks - Databricks SQL | Microsoft Learn
質問 # 23
Delta Lake stores table data as a series of data files, but it also stores a lot of other information.
Which of the following is stored alongside data files when using Delta Lake?
- A. Data summary visualizations
- B. Table metadata, data summary visualizations, and owner account information
- C. Owner account information
- D. None of these
- E. Table metadata
正解:E
解説:
Delta Lake stores table data as a series of data files in a specified location, but it also stores table metadata in a transaction log. The table metadata includes the schema, partitioning information, table properties, and other configuration details. The table metadata is stored alongside the data files and is updated atomically with every write operation. The table metadata can be accessed using the DESCRIBE DETAIL command or the DeltaTable class in Scala, Python, or Java. The table metadata can also be enriched with custom tags or user-defined commit messages using the TBLPROPERTIES or userMetadata options. Reference:
Enrich Delta Lake tables with custom metadata
Delta Lake Table metadata - Stack Overflow
Metadata - The Internals of Delta Lake
質問 # 24
Which of the following is an advantage of using a Delta Lake-based data lakehouse over common data lake solutions?
- A. ACID transactions
- B. Open-source formats
- C. Flexible schemas
- D. Scalable storage
- E. Data deletion
正解:A
解説:
A Delta Lake-based data lakehouse is a data platform architecture that combines the scalability and flexibility of a data lake with the reliability and performance of a data warehouse. One of the key advantages of using a Delta Lake-based data lakehouse over common data lake solutions is that it supports ACID transactions, which ensure data integrity and consistency. ACID transactions enable concurrent reads and writes, schema enforcement and evolution, data versioning and rollback, and data quality checks. These features are not available in traditional data lakes, which rely on file-based storage systems that do not support transactions. Reference:
Delta Lake: Lakehouse, warehouse, advantages | Definition
Synapse - Data Lake vs. Delta Lake vs. Data Lakehouse
Data Lake vs. Delta Lake - A Detailed Comparison
Building a Data Lakehouse with Delta Lake Architecture: A Comprehensive Guide
質問 # 25
A data engineering team has created a Structured Streaming pipeline that processes data in micro-batches and populates gold-level tables. The microbatches are triggered every minute.
A data analyst has created a dashboard based on this gold-level data. The project stakeholders want to see the results in the dashboard updated within one minute or less of new data becoming available within the gold-level tables.
Which of the following cautions should the data analyst share prior to setting up the dashboard to complete this task?
- A. The streaming cluster is not fault tolerant
- B. The required compute resources could be costly
- C. The gold-level tables are not appropriately clean for business reporting
- D. The streaming data is not an appropriate data source for a dashboard
- E. The dashboard cannot be refreshed that quickly
正解:B
解説:
A Structured Streaming pipeline that processes data in micro-batches and populates gold-level tables every minute requires a high level of compute resources to handle the frequent data ingestion, processing, and writing. This could result in a significant cost for the organization, especially if the data volume and velocity are large. Therefore, the data analyst should share this caution with the project stakeholders before setting up the dashboard and evaluate the trade-offs between the desired refresh rate and the available budget. The other options are not valid cautions because:
B) The gold-level tables are assumed to be appropriately clean for business reporting, as they are the final output of the data engineering pipeline. If the data quality is not satisfactory, the issue should be addressed at the source or silver level, not at the gold level.
C) The streaming data is an appropriate data source for a dashboard, as it can provide near real-time insights and analytics for the business users. Structured Streaming supports various sources and sinks for streaming data, including Delta Lake, which can enable both batch and streaming queries on the same data.
D) The streaming cluster is fault tolerant, as Structured Streaming provides end-to-end exactly-once fault-tolerance guarantees through checkpointing and write-ahead logs. If a query fails, it can be restarted from the last checkpoint and resume processing.
E) The dashboard can be refreshed within one minute or less of new data becoming available in the gold-level tables, as Structured Streaming can trigger micro-batches as fast as possible (every few seconds) and update the results incrementally. However, this may not be necessary or optimal for the business use case, as it could cause frequent changes in the dashboard and consume more resources. Reference: Streaming on Databricks, Monitoring Structured Streaming queries on Databricks, A look at the new Structured Streaming UI in Apache Spark 3.0, Run your first Structured Streaming workload
質問 # 26
......
実験された試験材料はDatabricks-Certified-Data-Analyst-Associate:https://www.jpntest.com/shiken/Databricks-Certified-Data-Analyst-Associate-mondaishu
最新Databricks-Certified-Data-Analyst-Associateリアル試験問題をフォローせよ!:https://drive.google.com/open?id=1AoNwQVGylNXctLkBwOoXXznOXq8JrdfI